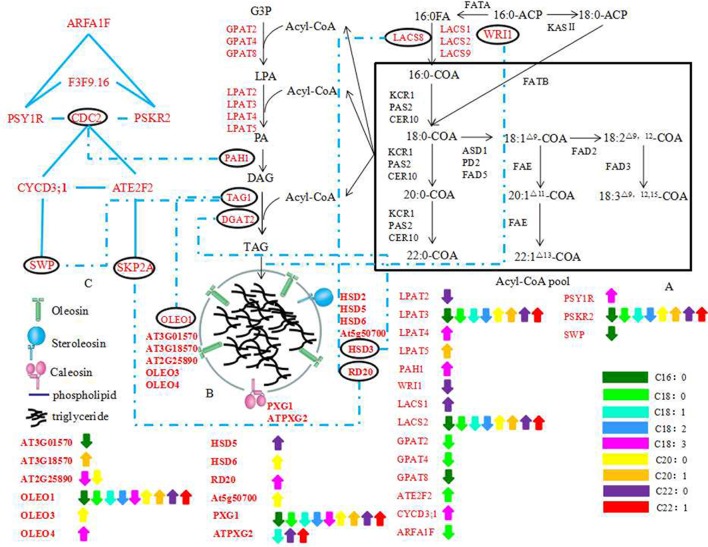
Figure 7.
The potential regulation pathway of the genes associated with OB morphology, oil content and FA compositions. (A) FAs biosynthetic and Acyl-CoA pool formation; (B) a schematic model of mature oil body surrounded by OB-membrane proteins; (C) a simple Schematic Model of cell division, growth, proliferation. The black characters indicate genes detected in previous studies, the red characters indicate the candidate genes in this study. The blue dotted materials indicate the combine between genes in different classification. The Blue materials indicate the combine between genes in same classification. The double-headed arrows indicate genes underlying different QTLs which affect the same trait with opposite additive effect at the same time based on the WinQTLcart2.5 and QTLNetwork_2.0 results (not the combined results of the two). Different colors denote different traits as the bar showed at the lower right corner of the picture. The abbreviations of gene name are same with Table S5.

