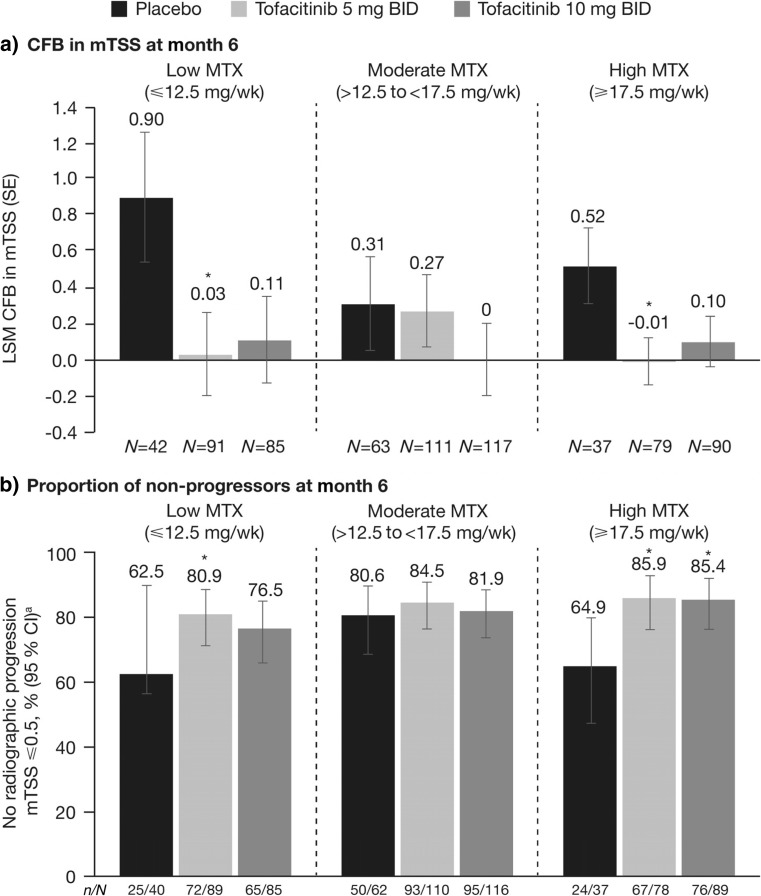
Fig. 3.
Radiographic progression at month 6 by MTX dose category: a LSM change from baseline in mTSS and b proportion of patients with no radiographic progression (mTSS ≤0.5). *p < 0.05 vs placebo; aNon-responder imputation; Full Analysis Set. BID twice daily, CFB change from baseline, CI confidence interval, LSM least squares mean, mTSS modified Total Sharp/van der Heijde Score, MTX methotrexate, SE standard error, wk week

