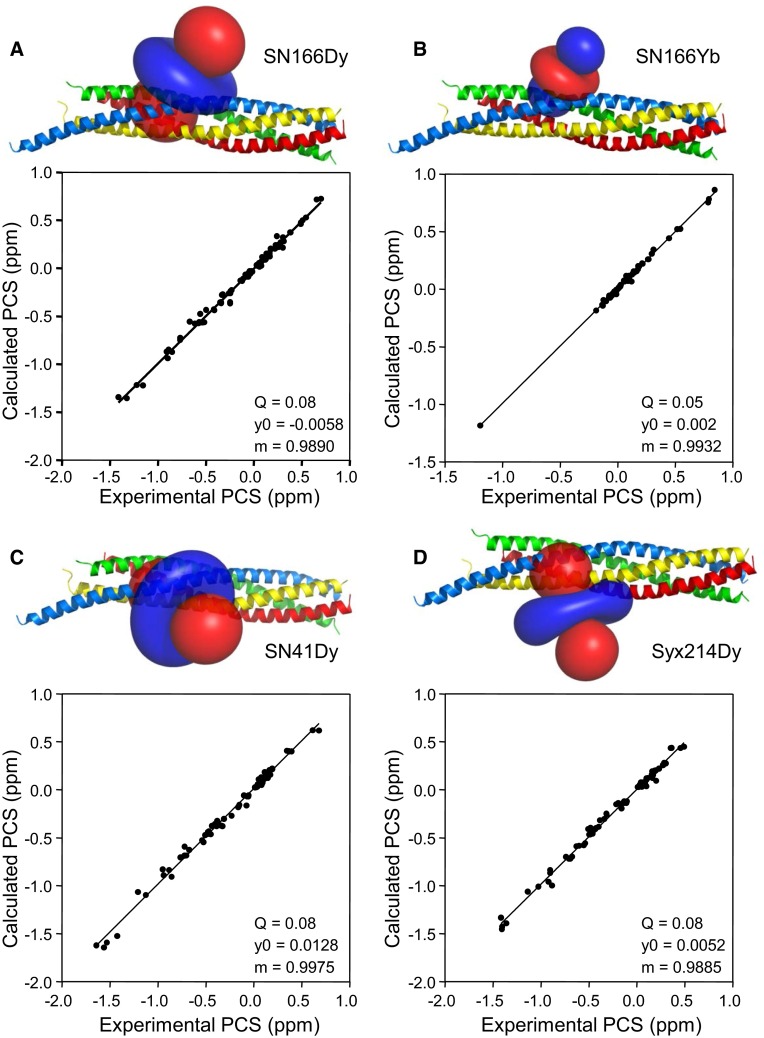
Fig. 6.
Anisotropic magnetic susceptibility tensors and correlations of observed versus predicted PCSs. a–d The top of each panel shows a ribbon diagram of the SNARE complex (syntaxin-1 in yellow, synaptobrevin in red, SNN in blue and SNC in green) (PDB code 1N7S) with isosurfaces representing regions with positive (blue) or negative (red) PCSs, contoured at ±0.8 ppm, with the Δχ tensors derived for SN166Dy (a), SN166Yb (b), SN41Dy (c) and Syx214Dy (d). The bottom of each panel shows the correlation between experimental PCSs measured for each complex and those calculated with the corresponding Δχ tensor. Q factors (Q), slopes (m) and y axis intercepts (y0) are indicated. Q factors were calculated as the root mean square deviation between measured and calculated PCSs divided by the root mean square of the measured PCSs

