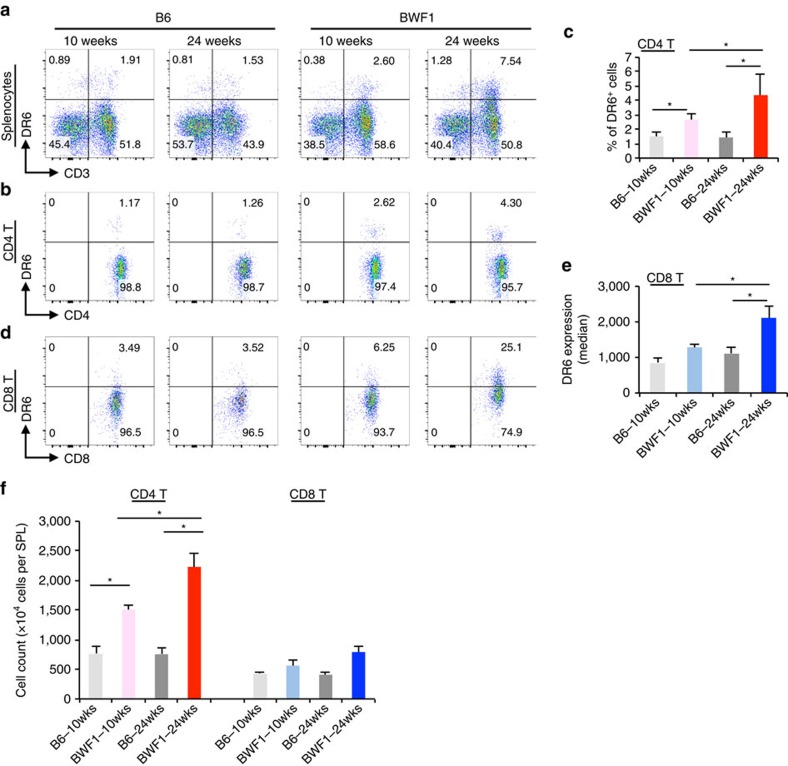
Figure 1. Disease-specific induction of DR6+ CD4+ T cells in lupus-prone BWF1 mice.
Total splenocytes obtained from the indicated mice were stained with anti-DR6 specific monoclonal antibody (clone 25-1) with anti-CD3, CD8 and CD4 specific Abs. (a) Total splenocytes (gated as live singlet cells shown in Supplementary Fig. 15a) were analysed on CD3 versus DR6 dot plot. Numbers in the dot plots indicates percentage of the cells gated. (b) CD4+ T cells (CD3+ CD8− CD4+) of the total splenocytes were also analysed on CD4 versus DR6 dot plots. (c) Quantification of the percentage of DR6+ cells in the CD4+ T cells. Error bars represent standard deviation (s.d.) (n=5 per group). (d) CD8+ T cells (CD3+ CD8+ CD4−) of splenocytes of the indicated mice were analysed on CD8 versus DR6 dot plots. (e) DR6 expression (median of fluorescent intensity, MFI) on CD8+ T cells was also quantified. (f) Actual numbers of total CD4+ T or CD8+ T cells (detected as shown in Supplementary Fig. 15b) were also counted in splenocytes obtained from these mice. Error bar: s.d. (n=5 per group). Asterisks indicate statistical significance (P<0.05, Student's t-test).

