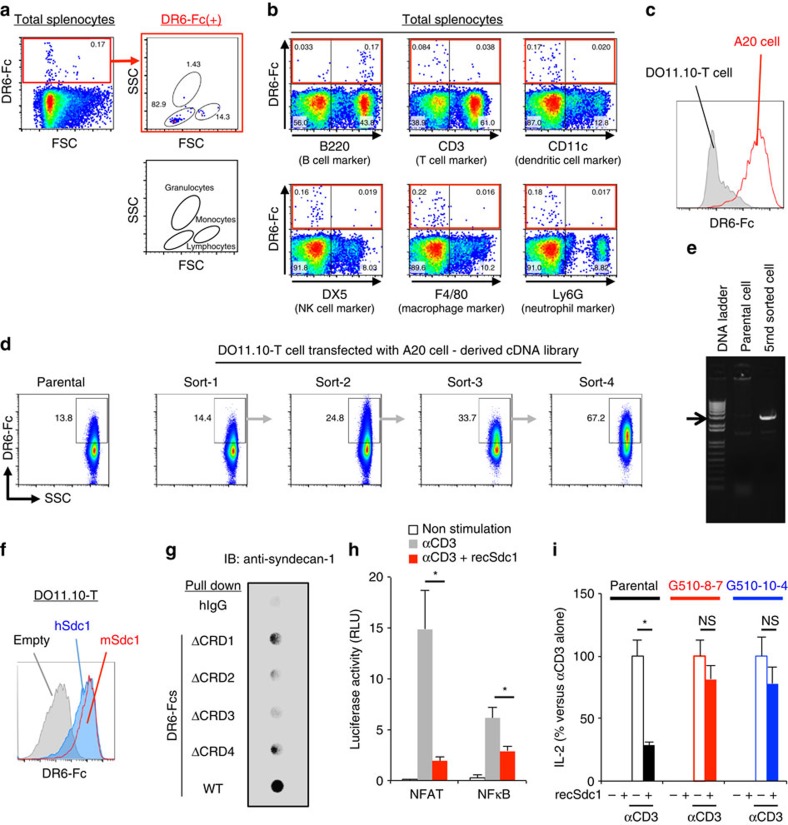
Figure 3. Identification of syndecan-1 as a functional binding partner for the DR6 ectodomain.
(a; left panel) Total splenocytes of B6 mice were stained with biotinylated murine DR6-Fc plus allophycocyanin-conjugated streptavidin. (upper right panel) Cells bound to DR6-Fc among live singlet splenocytes were analysed on FSC versus SSC dot plots. (lower right panel) The gating shown in the FSC versus SSC dot plot is also schematically explained. (b) Total splenocytes were also stained with DR6-Fc and antibody for detecting the indicated cell type. (c) A20 or DO11.10-T cells were stained with DR6-Fc. DR6-Fc specific fluorescent intensity of these cell lines is shown. (d) DO11.10-T cells transfected with a cDNA library derived from A20 cells were stained with DR6-Fc. The transfectants bound to DR6-Fc were collected by four rounds of sorting and expansion. (e) After the fifth round of sorting, the cDNA library inserted in genomic DNA of the selected transfectants was isolated as a single cDNA fragment (∼3,000 bp). (f) Intensity of DR6-Fc staining on DO11.10-T cells ectopically expressing Syndecan-1 of mouse (mSdc1) or human (hSdc1) or empty plasmid. (g) Endogenous syndecan-1 of A20 cells was precipitated with the indicated Fc-fusion proteins and detected as described in Methods section. WT means Fc protein fused with the extracellular region of DR6 wild type, ΔCRD1 means the fusion protein lacking CRD1, ΔCRD2, lacking CRD2, ΔCRD3, lacking CRD3 or ΔCRD4, lacking CRD4. (h) DO11.10-T cells were transfected with the indicated reporter plasmid with reference plasmid. The cells were then stimulated with the indicated combination of recombinant syndecan-1 protein (recSdc1, 30 nM) and anti-CD3 Ab (10 μg ml−1). Six hours after the stimulation, reporter activities of the cells were assessed. Error bar: s.d. (n=3 per group). (i) Parental DO11.10-T or its DR6-knockout clone (G510-8-7 or G510-10-4) was stimulated as described in h. Twelve hours after the stimulation, IL-2 production of the cells was assessed as described in Methods section. Error bar: s.d. (n=3 per group). Details of the DR6 knock out single cell clones is also shown in Supplementary Fig. 1c,d. Asterisks or NS in each panel indicate statistical significance (P<0.05, Student's t-test) or not significance, respectively.

