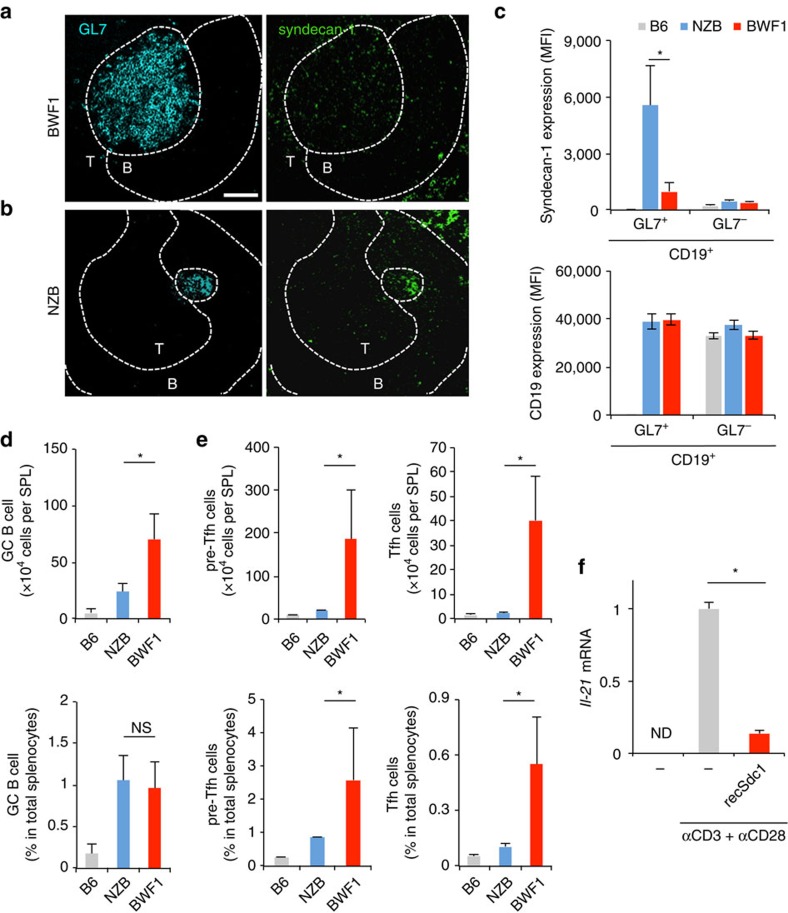
Figure 4. Syndecan-1 induction on GC B cells in lupus-prone mice.
(a–e) Spleens were isolated from 24-week-old female BWF1, NZB or B6 mice. Splenic cryosections obtained from the BWF1 (a) or NZB (b) mice were stained by anti-GL7 (left panel) and syndecan-1 (right panel) specific antibodies. Additional anti-CD4 Ab staining was also used for identifying the border between B and T cell zone. Representative images of at least 3 independent fields per slide are shown. B, B cell zone; T, T cell zone. Dashed line indicates the border between each region. Bar=100 μm. (c) GL7+ CD19+ and GL7− CD19+ B cell populations obtained from the indicated mice were detected by flow cytometry with the gate strategy that is shown in Supplementary Fig. 15d. The expression levels of syndecan-1 (upper panel) and CD19 (lower panel) on the detected B cell populations were shown. Error bar: s.d. (n=3 for B6, 5 for NZB, 5 for BWF1 per group). (d) Mean number (upper panel) or percentage (lower) of the GL7+ CD19+ GC B cell in live total splenocytes obtained from the indicated mice. Error bar: s.d. (n=3 for B6, 5 for NZB, 5 for BWF1 per group). (e) The number (upper panel) or percent (lower) of pre-Tfh (left) or Tfh cells (right) of live total splenocytes from the indicated mice are also analysed with the gate strategy shown in Supplementary Fig. 15c. Error bar: s.d. (n=5 per group). (f) CD3+ CD4+ PD1high/int CXCR5high/int CXCR4+ cells were isolated from 24-week-old female BWF1 mice. The cells were stimulated with the indicated combinations of recSdc1 (30 nM), anti-CD3 Ab (10 μg ml−1) and anti-CD28 Ab (10 μg ml−1). Seventy-two hours after the indicated stimulations, Il-21 mRNA production in the cells was analysed by qPCR. Error bar: s.d. (n=3 per group). ND, not detected. Asterisks in each panel indicate statistical significance (P<0.05, Student's t-test).

