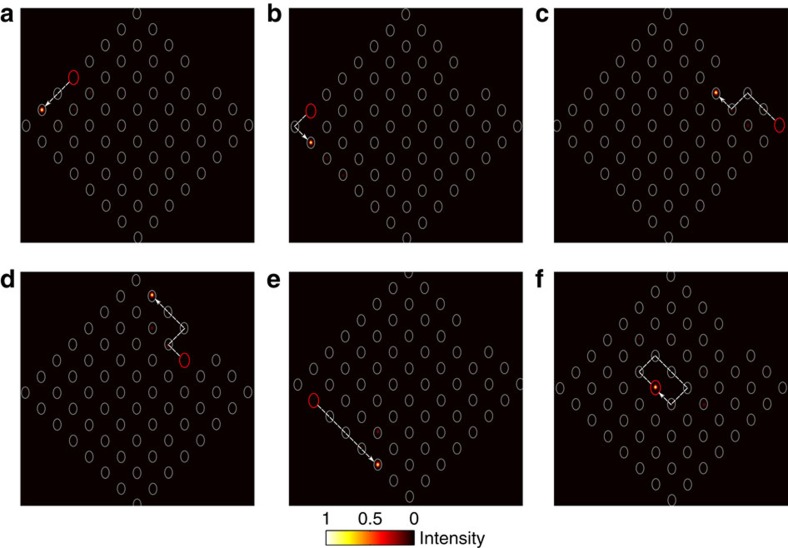
Figure 3. Experimental observation of anomalous topological edge modes.
Experimentally measured output intensity distribution when the light is launched at the lattice site indicated by the red circle. The figures display chiral edge modes (a–e) that are not scattered by corners (b) nor defects (c,d) as well as a largely localized bulk state (f). The group velocity of the chiral edge modes along the bottom left edge of the lattice (e) is twice of that along the top left edge (a), which stems from the bond J1 having a different strength to the other three bonds.

