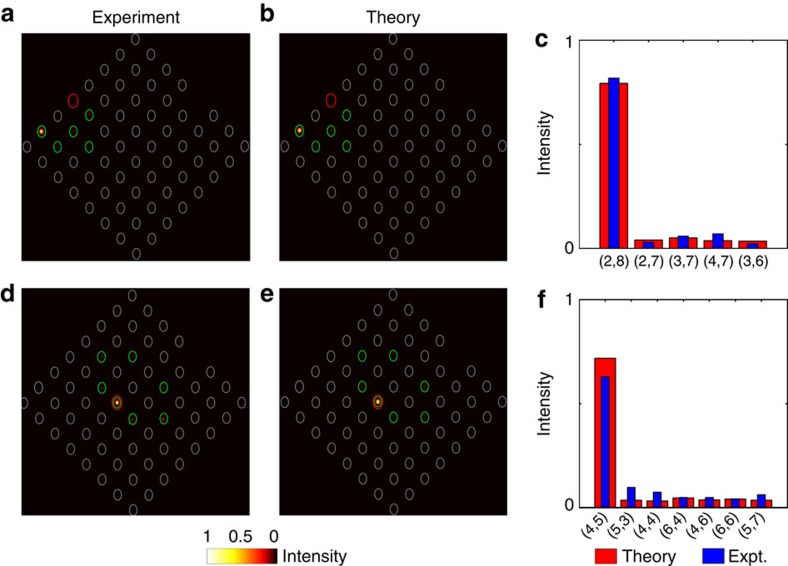
Figure 5. Comparison between experiment and theory.
(a) Same result as in Fig. 3a, but using a different colour-scale so as to highlight the low intensities (bulk response). (b) Theoretical simulation of the intensity distribution, from a numerical resolution of the Schrödinger equation associated with the Floquet (effective) Hamiltonian. (c) Relative light intensity at the lattice sites where light was detected at the output (see green circles in a,b), showing the comparison between (a,b). Here the sites coordinates correspond to the axis orientation defined in Fig. 1f. (d) Same as Fig. 3f, and the corresponding simulated intensity distribution is shown in e. (f) Comparison between d,e.

