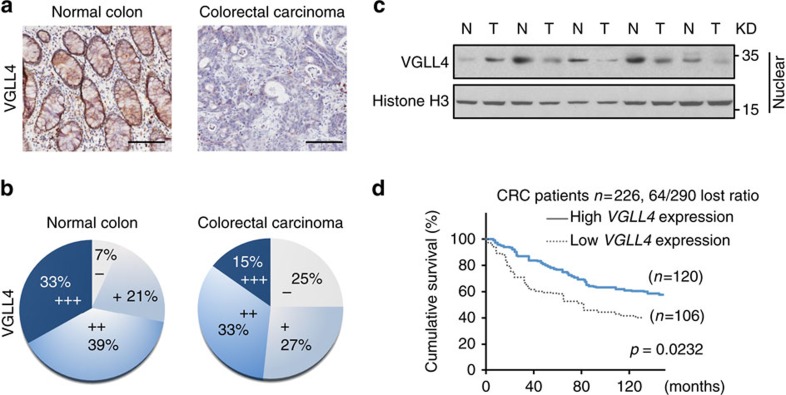
Figure 1. VGLL4 levels are decreased in the CRC samples.
(a) Representative images of VGLL4 staining on tissue microarray. Scale bar denotes 100 μm. (b) VGLL4 staining levels of normal and cancerous colon tissue indicating negative (−), weak (+), moderate (++), strong (+++) VGLL4 expression levels. (c) Levels of VGLL4 protein in five human colorectal carcinomas and their paired adjacent normal tissues were analysed. (d) Kaplan–Meier survival analysis of patients with high (n=226) or low (n=106) VGLL4 mRNA levels from GSE14333 dataset by using the logrank test. Survival curves were calculated according to the Kaplan–Meier method. P<0.05 was considered to indicate a significant difference. See also Supplementary Fig. 1.

