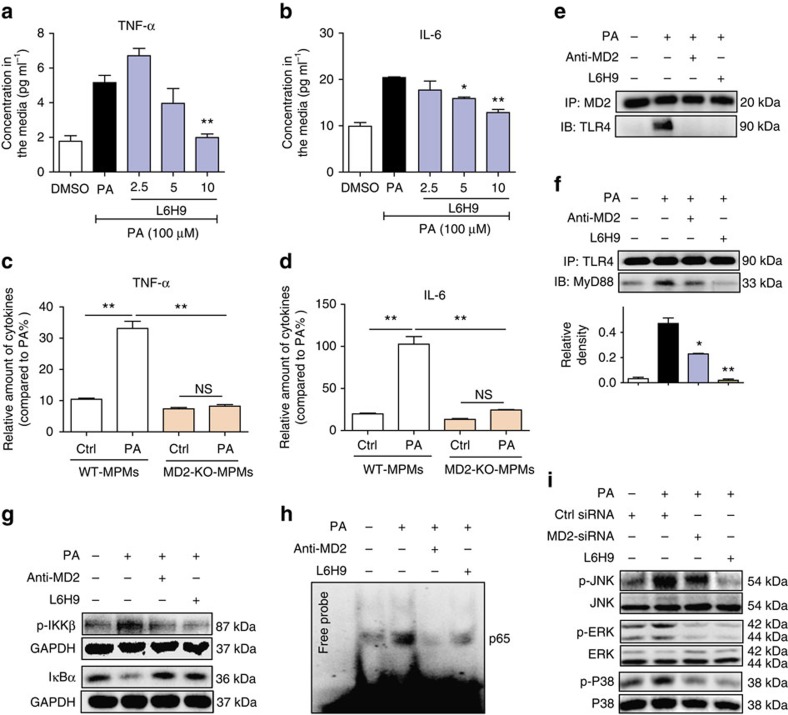
Figure 3. PA induces MD2/TLR4 complex formation and signalling.
(a,b) Effects of MD2 inhibitor L6H9 on secretion of TNF-α (a) and IL-6 (b) by mouse primary macrophages stimulated with 100 μM PA for 24 h. Cytokine concentrations in the condition medium were measured by ELISA and reported as pg ml−1 (n=3). (c,d) Effects of PA stimulation (100 μM for 24 h) on cytokine secretion from primary macrophages isolated from Md2−\− or wild-type mice, KO-MPM or WT-MPM, respectively. Graphs show relative amounts of TNF-α (c) and IL-6 (d) (n=3). (e,f) Effects MD2 blockade on formation of the MD2/TLR4–MyD88 complex in macrophages stimulated with 100 μM PA for 5 min. MD2 blockade was achieved by MD2-neutralizing antibody (anti-MD2, 100 ng ml−1) or MD2 inhibitor (L6H9, 10 μM). Shown are representative (n=3) western blots (IBs) from the co-precipitation (IP) studies for MD2/TLR4 complex formation (e) and TLR4/MyD88 complex formation (f). (g,h) Effects of MD2 blockade on NF-κB activity in mouse macrophages stimulated with 100 μM PA (30 min); MD2 blockade was achieved by anti-MD2 or 10 μM L6H9. Shown are (g) representative western blot for p-IKKβ and IκB-α (n=3), and (h) EMSA analysis for NF-κB DNA-binding activity (n=3). (i) Effects of MD2 inhibition through knockdown or L6H9 pretreatment (10 μM) on MAPK pathway activation in macrophages stimulated with 100 μM PA for 30 min. Shown are representative western blots of phosphorylated JNK, ERK and P38 (densitometric quantification for g–i from three separate determinations were shown in Supplementary Figs 11a,b and 12a, respectively). Data are reported as mean±s.e.m. and analysed by Student’s t-test, *P<0.05, **P<0.01 compared with PA or WT-MPMs; NS, not significant.

