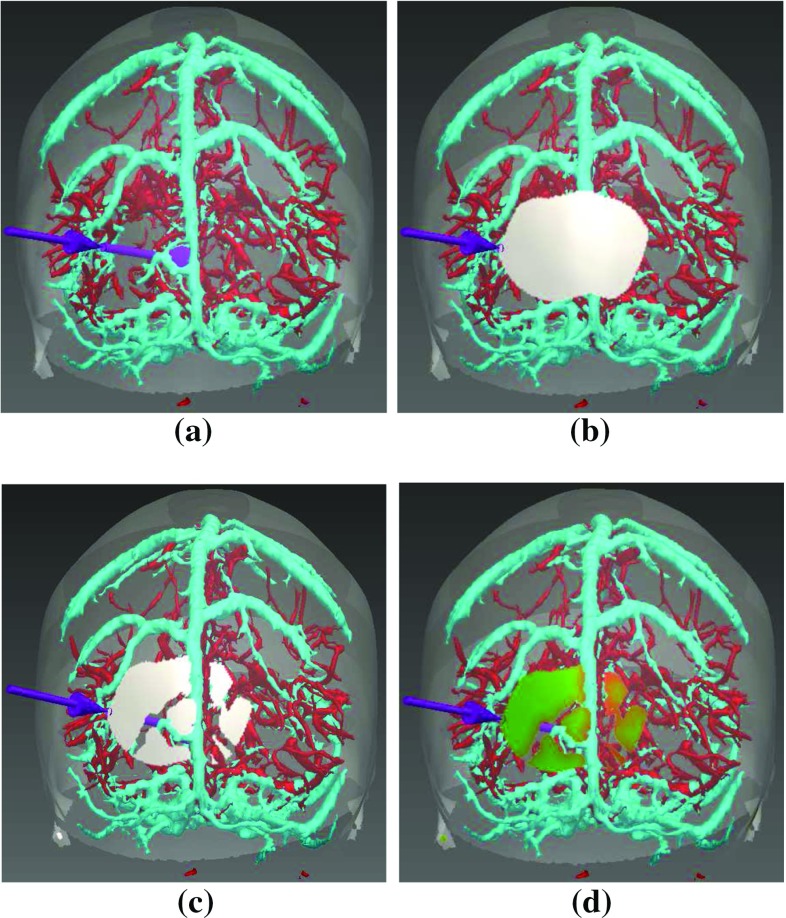
Fig. 2.
Entry point search algorithm. Critical structures are arteries (red), veins (cyan), and sulci (not shown). The lowest risk trajectory is displayed in purple (arrow indicating entry and sphere indicating target). a Initial set of potential entry points obtained from the skull template (semi-transparent white). b Opaque white patch corresponds to after excluding trajectories due to length or angle. c Opaque white patch corresponds to after excluding trajectories due to critical structure intersection. d Coloured patch corresponds to risk scores with low (0—green) to high (1—red) risk

