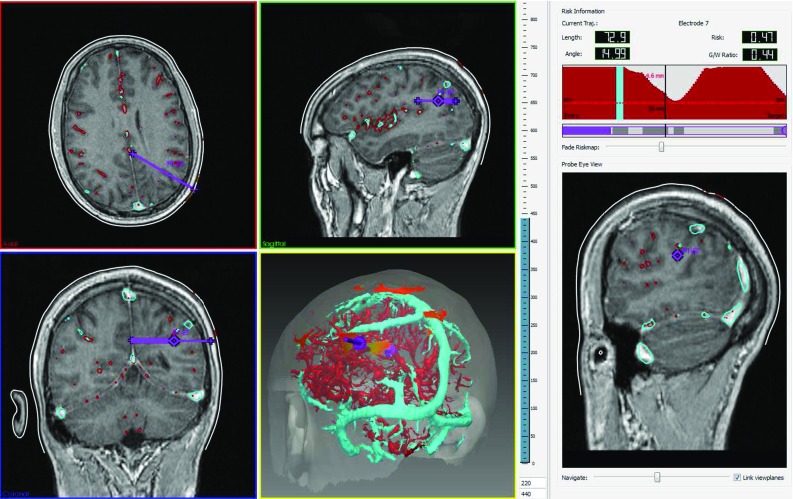
Fig. 3.

EpiNav software platform. Upper panels (left to right) show the axial and sagittal imaging planes and trajectory profile described in the sections “Quantitative measures” and “Trajectory profile”. Lower panels (left to right) show the coronal imaging plane, volumetric view, and probe eye view (described in the section “Probe eye view”). The volumetric view displays critical structures (veins in cyan, arteries in red), skull template (transparent white), trajectory (purple), and entry points coloured according to risk score from low (0—green) to high (1—red). In this example, a trajectory with intermediate risk (—orange) is selected. The risk information shows intermediate risk is due to the trajectory traversing near an artery
