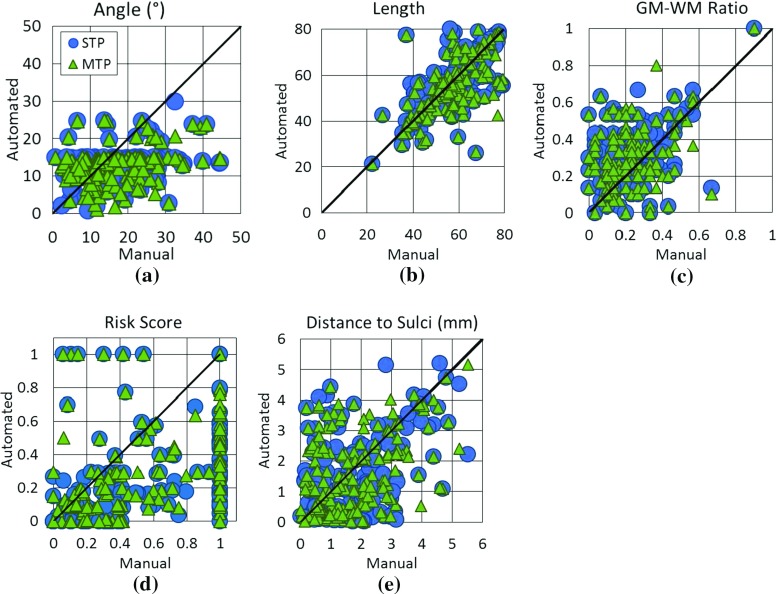
Fig. 5.
Quantitative measures for trajectories determined by MP (plotted on the Xaxis) versus automated planning (plotted on the Yaxis) for a angle, b length, c GM-WM ratio, d risk score, and e distance to the closest sulci. Points below the diagonal line represent trajectories where automated planning reduced the value compared to MP. For a angle, b length, and d risk score lower values (points below the diagonal) are preferred. For b GM-WM ratio and e distance to the closest sulci higher values (points above the diagonal) are preferred

