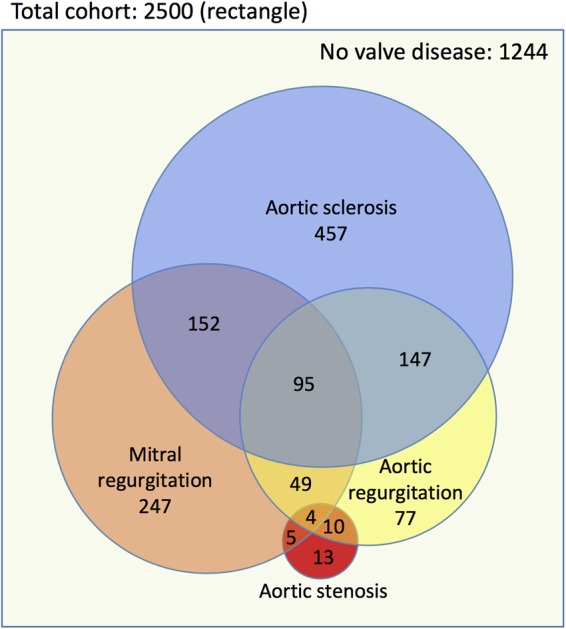
Figure 2.

Venn diagram demonstrating the distribution of single and multiple left-sided valve abnormalities in OxVALVE participants with newly diagnosed valvular heart disease. The outer rectangle represents the full cohort (n = 2500) and the area of each circle is proportionate to the number of participants with different manifestations of left-sided valvular heart disease. Numbers denote the number of participants in each group.
