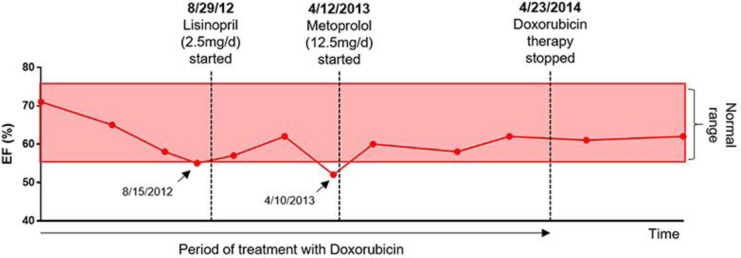
Fig. 3.
Image showing EF (%) over time as measured by echocardiogram. Two points at the lower limit of normal or below the normal EF limit (arrows) were treated immediately with therapeutic intervention by cardiology, each of which was able to restore the EF to normal limits. The EF remained stable over the course of doxorubicin treatment and afterwards. Each point represents the date at which the patient had an echocardiogram. EF, ejection fraction.

