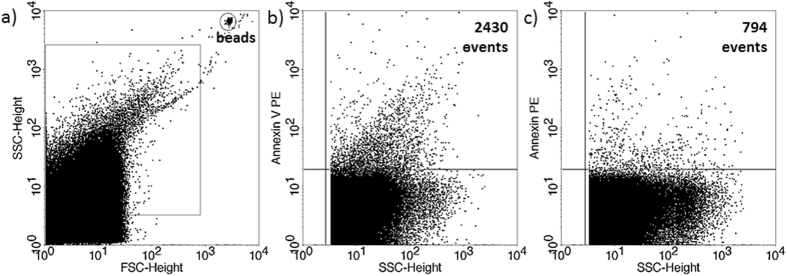
Figure 1. Annexin V staining of embryo-derived EVs in embryo culture medium.
(a) Representative FSC-SSC dot plot shows the size distribution of EVs in embryo culture medium. (b) Representative dot plot shows the phycoerythrin (PE) fluorescence of EVs after AnnexinV-PE labelling. (c) Representative dot plot shows the PE fluoresce after Triton-X 100 differential detergent lysis.

