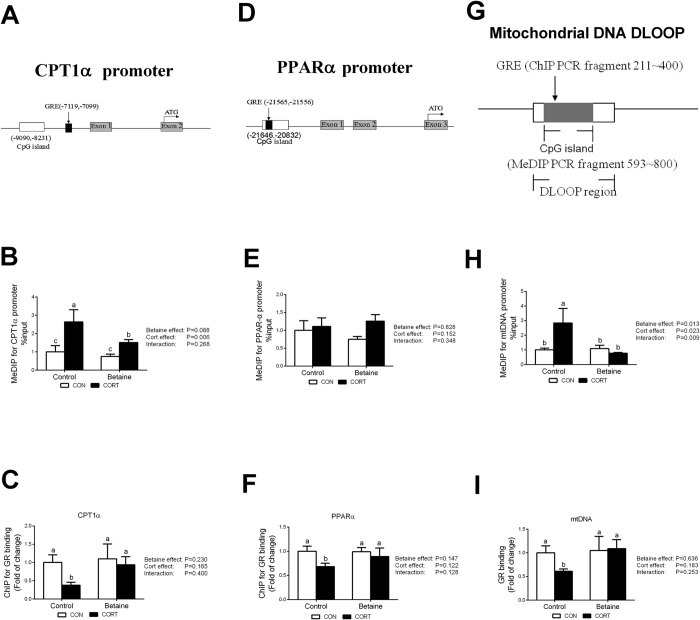
Figure 7. DNA methylation status and GR binding to the promoter of CPT1α and PPARα, as well as the D-loop region of mtDNA.
(A) Schematic diagram showing the promoter sequence of chicken CPT1α gene. CpG sites (−9090~−8231) and GRE (−7119~−7110), determined in this study, on 5′-flanking promoter regions of CPT1α relative to the translation start codon (ATG) are underlined. (B) Methylation status on the promoter of CPT1α gene. (C) ChIP assays of GR binding on CPT1α gene promoter. (D) Schematic diagram showing the promoter sequence of chicken PPARα gene. CpG sites (−21646~−20832) and GRE (−21565~−21556), determined in this study. (E) Methylation status on the promoter of PPARα gene. (F) ChIP assays of GR binding on PPARα gene promoter. (G) Schematic diagram of Rugao yellow chicken mitochondrial D-loop region. The sequences of Rugao yellow chicken mitochondrial was according to PubMed (KP742951.1). CpG sites (346~905) and GRE (303~312), determined in this study. (G) Methylation status on the D-loop region of mtDNA. (H) ChIP assays of GR binding to D-loop region of mtDNA. C = Control; B = Betaine; CON = vehicle; CORT = Corticosterone; Values are means ± SEM, means without a common letter differ, P < 0.05 (n = 8).

