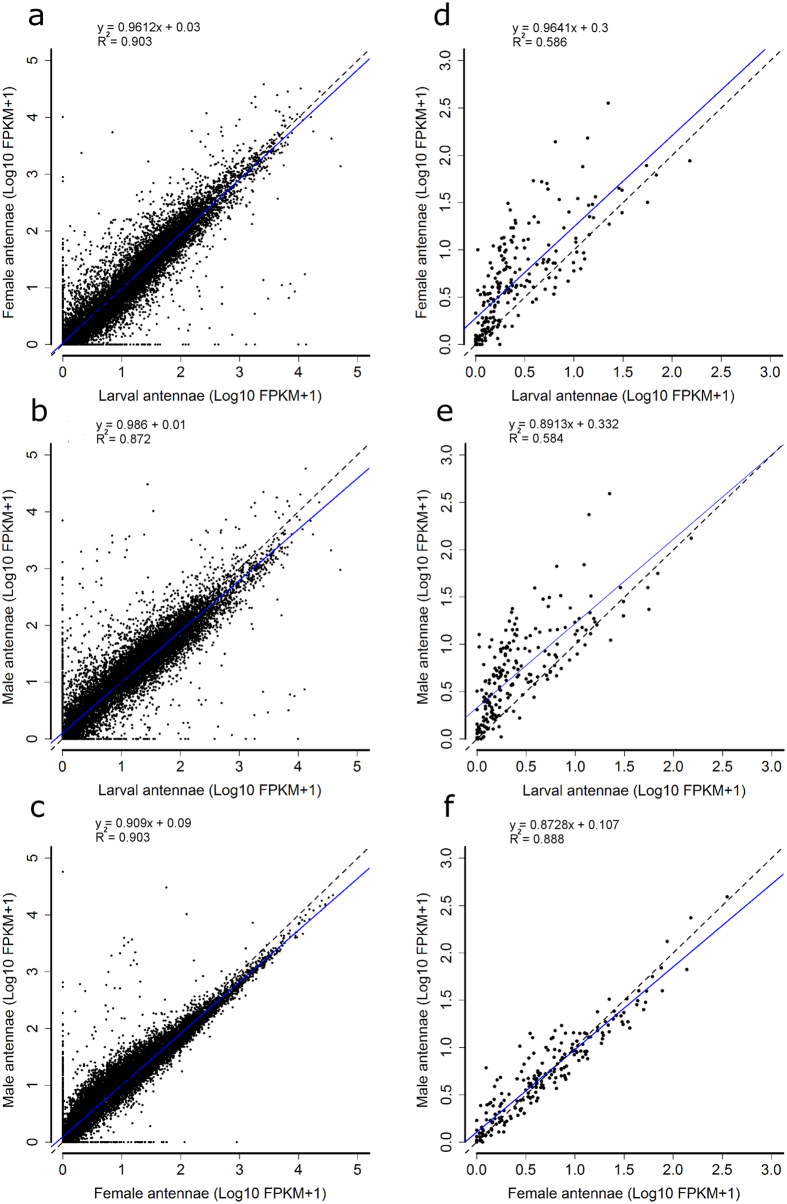
Figure 1. Pair-wise comparison of the three transcriptome libraries.
On the left, comparison of expression levels of the 17,190 genes predicted: between larval vs. adult female transcriptomes (a); larval vs. adult male transcriptomes (b) and; female vs. male adult transcriptomes (c). On the right, comparisons of the expression levels of a set of 217 sensory receptor genes between the larval vs. adult female transcriptomes (d); larval vs. adult male transcriptomes (e) and; between female vs. male adult transcriptomes (f). Dotted lines indicate 1:1 gene expression relationship between the compared antennal transcriptomes, while linear regression analyses were marked with blue solid lines.

