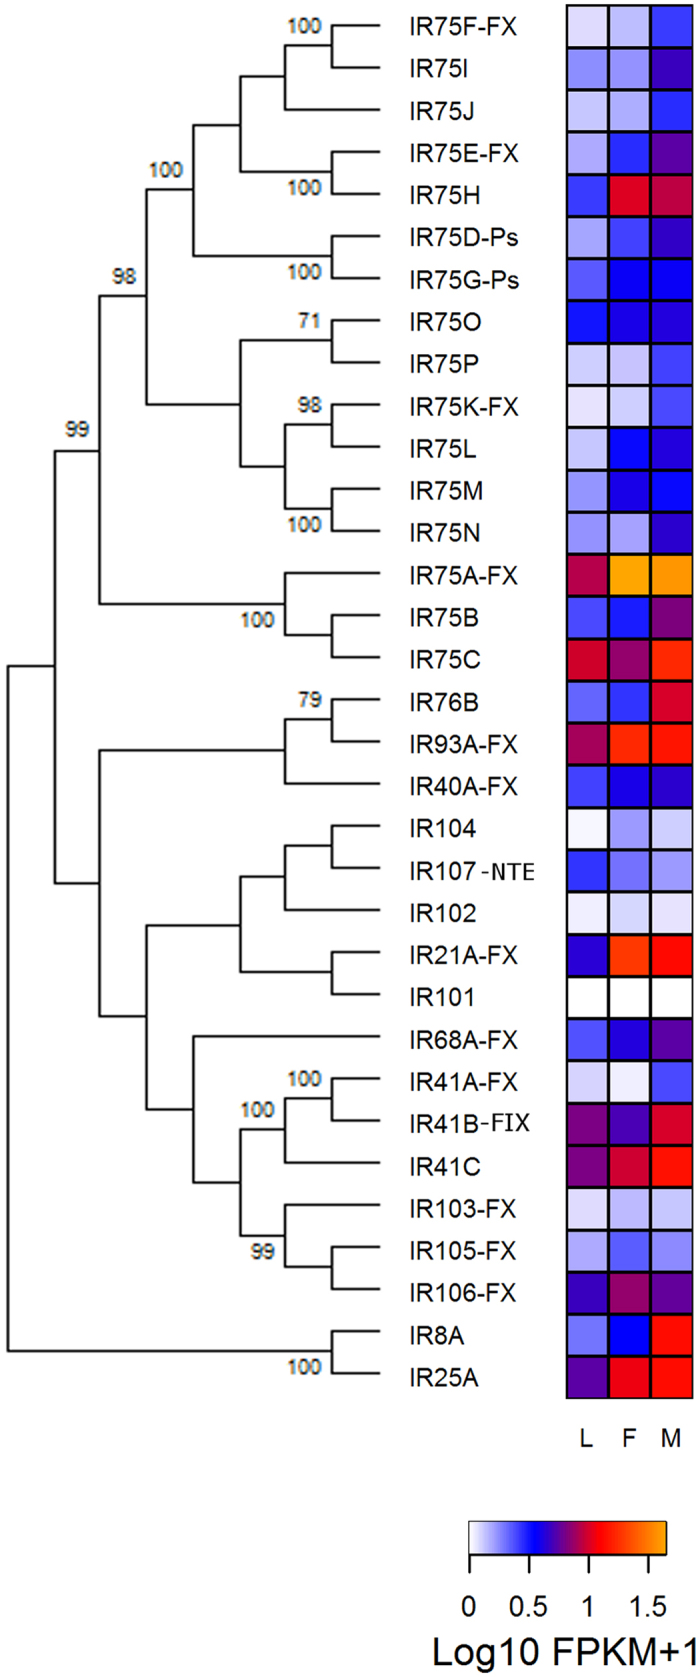
Figure 3. Phylogenetic relationship of ionotropic receptors (IRs) and heat map comparing their expression levels in antennae of larvae (L), female (F) and male (M) adults of R. prolixus.

The IR evolutionary history was inferred using the Maximum Likelihood method in MEGA6.0. The bootstrap consensus tree (which topology is displayed) was inferred from 1,000 pseudo-replicates. Only bootstrap values higher than 70 were displayed. Initial tree was obtained by applying the Neighbor-Joining method to a matrix of pairwise distances estimated using the WAG and F models. Expression levels (represented as Log10 FPKM +1) were depicted with a colour scale in which white and orange represent lowest and highest expression, respectively. Suffixes to gene names are explained in the Methods section.
