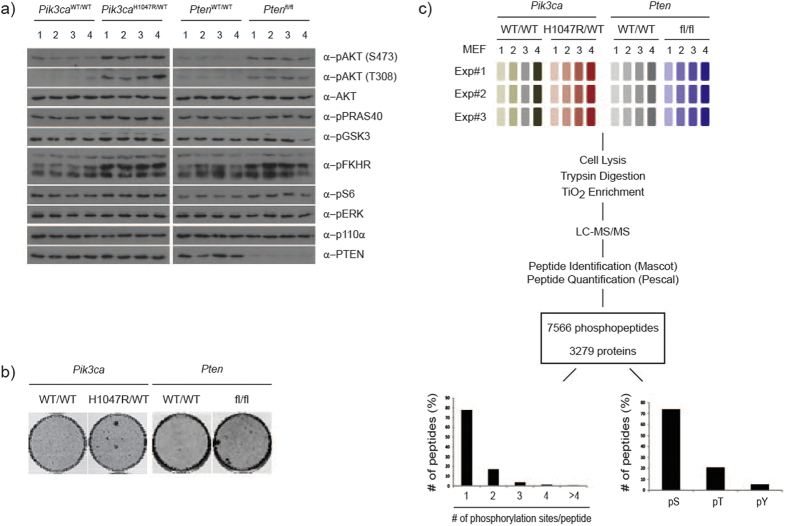
Figure 1. Cellular models and phosphoproteomic workflow.
(a) Western blot analysis of primary MEF lysates from a representative mass spectrometry experiment. Each lane represents an independent MEF line. (b) Focus formation assay of p53-immortalized MEFs of the indicated genotype. (c) Experimental design and workflow. Four individual MEF lines were used per genotype and the experiment was repeated 3 times.

