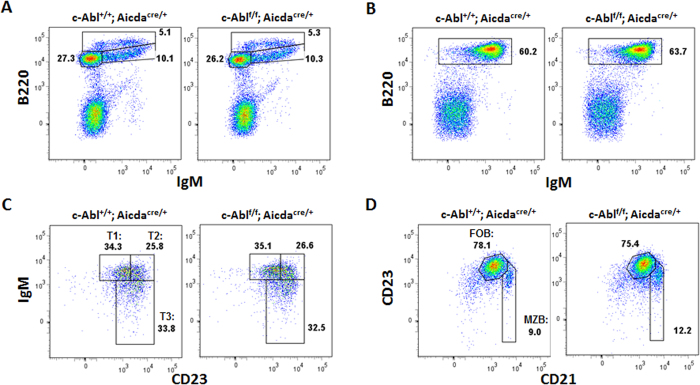
Figure 2. Examination of B cell populations in control and c-Ablf/f Aicdacre/+ mice.
B cell populations in the (A) bone marrow and (B-D) spleens of c-Abl+/+ Aicdacre/+ (control) and c-Ablf/f Aicdacre/+ mice were determined using Flow cytometry. (A) Bone marrow cells were interrogated for expression of B220 and IgM. Numbers adjacent to gated areas indicate percent of total bone marrow cells. (B) Splenocytes were gated for B220+ IgM+ B cells and numbers shown indicate percent of total splenocytes. (C) CD19+ splenocytes were further interrogated for CD23 and IgM expression to define transitional T1 (CD23−IgM+), T2 (CD23+IgM+) and T3 (CD23+IgM−) subsets. (D) Gated splenic CD19+ cells were interrogated for CD23 and CD21 expression level. Follicular B (CD23+CD21+) and marginal zone B cells (CD23−CD21++) were determined. Numbers shown are percent of CD19+ B cells. Data shown are representative of 3 independent experiments.

