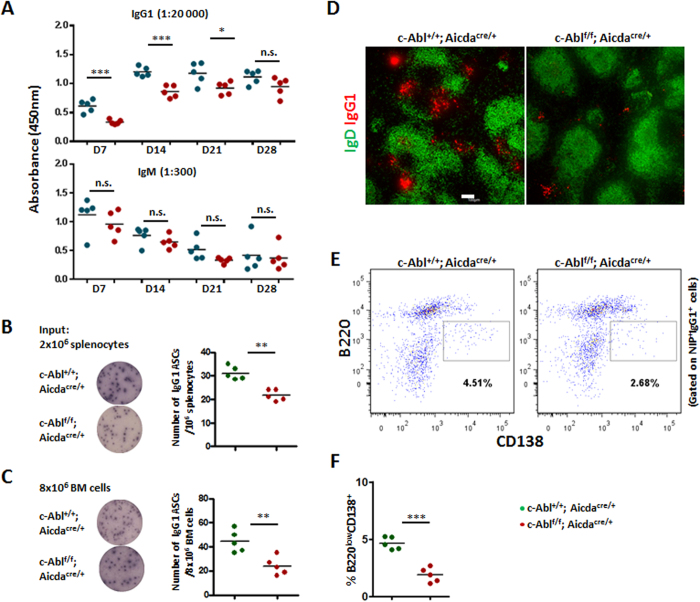
Figure 4. Impaired antibody response and reduced PC in c-Ablf/f Aicdacre/+ mice.
(A) Control and c-Ablf/f Aicdacre/+ mice were challenged with NP38-CGG and their sera antigen-specific IgG1 and IgM antibody levels at different time-points after immunization were determined via ELISA. Sera were diluted 20,000 and 300 times respectively, to measure NP-specific IgG1 and IgM antibodies. (B and C) ELISPOT analyses and quantification of antigen-binding IgG1 antibody-secreting cells (ASC) in the spleens (B) and bone marrow (C) of control and c-Ablf/f Aicdacre/+ mice 14 days after NP38-CGG immunization. (D) Confocal microscopy of spleen sections of NP38-CGG-challenged control and c-Ablf/f Aicdacre/+ mice at day 14 of immunization to visualize IgG1 PC (red, anti-IgG1) and B cell follicles (green, anti-IgD); white bar, 100 μm. Images shown are representative of three spleens analysed per group. (E) Flow cytometry analysis of NIP+IgG1+ spleen cells to further depict B220lowCD138+ plasma cells in day 14 immunized mice. (F) Quantification of antigen-specific B220lowCD138+ PC in the spleens of day 14 immunized control and c-Ablf/f Aicdacre/+ mice. Each dot represents one mouse analysed. *p < 0.05; **p < 0.01; ***p < 0.001.

