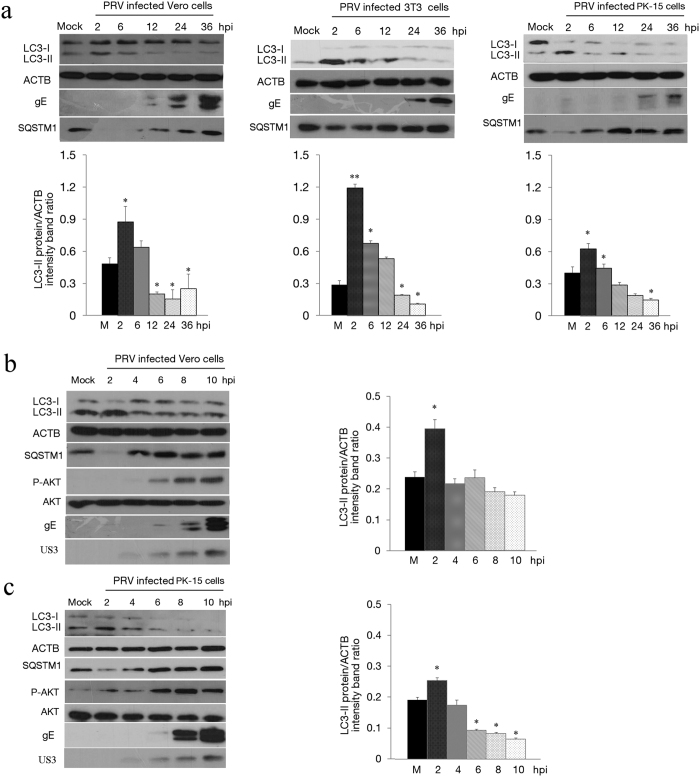
Figure 1. PRV infection modifies LC3 lipidation after infection in permissive cells.
(a) Vero, 3T3 and PK cells were mock infected or infected with PRV at MOI of 0.1. At 2, 6, 12, 24 or 36 h post-infection (hpi), the cells were lysed, separated by reducing SDS-PAGE, and subjected to a Western blot using antibodies against LC3, ACTB (β -actin), SQSTM1 or PRV gE protein as indicated. Densitometry was performed for quantification. The ratio of LC3-II to ACTB from three independent experiments is expressed as the mean ± SD. One-way ANOVA test; *P < 0.05; **P < 0.01, as compared with the mock infection group. Vero cells (b) and PK cells (c) were mock infected or infected with PRV at MOI of 10. At 2, 4, 6, 8 or 10 hpi, the cells were lysed, separated by reducing SDS-PAGE, and subjected to a Western blot using antibodies against LC3, ACTB, SQSTM1, AKT, p-AKT (p-Ser473), PRV gE protein or US3 protein as indicated. Densitometry was performed for quantification. The ratio of LC3-II to ACTB from three independent experiments is expressed as the mean ± SD. One-way ANOVA test; *P < 0.05, as compared with the mock infection group. Gels were run under the same experimental conditions. For better clarity and concise presentation, cropped blots are shown. The raw uncropped images can be found in Supplementary Fig. S1.

