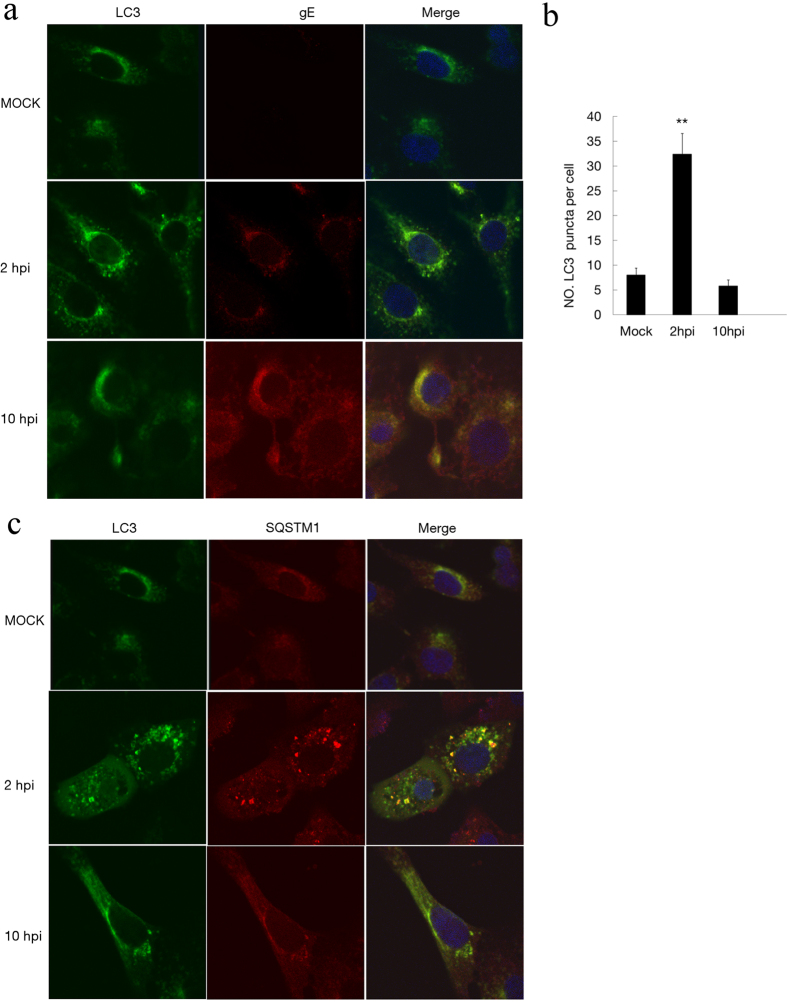
Figure 3. The formation of autophagosome-like vesicles in PRV-infected cells.
(a) Vero cells were mock infected or infected with PRV at an MOI of 10 for different times. Then, the cells were fixed and incubated with anti-LC3 antibody and anti-gE antibody in subsequence, followed by the corresponding secondary antibodies conjugated to FITC and TRITC as described in the Methods. The cell nuclei were counterstained with DAPI. Immunoconfocal microscopy analyses were performed. (b) The number of cells showing LC3 dots was counted, and at least 100 cells were included for each group. Error bars indicate the mean ± SD for 100 cells per experimental condition of three independent experiments. One-way ANOVA test; **P < 0.01, as compared with the mock infected group. (c) LC3 colocalization with SQSTM1 was assessed by immunoconfocal microscopy analysis. Vero cells were processed as described in the Methods section. The cell nuclei were counterstained with DAPI.

