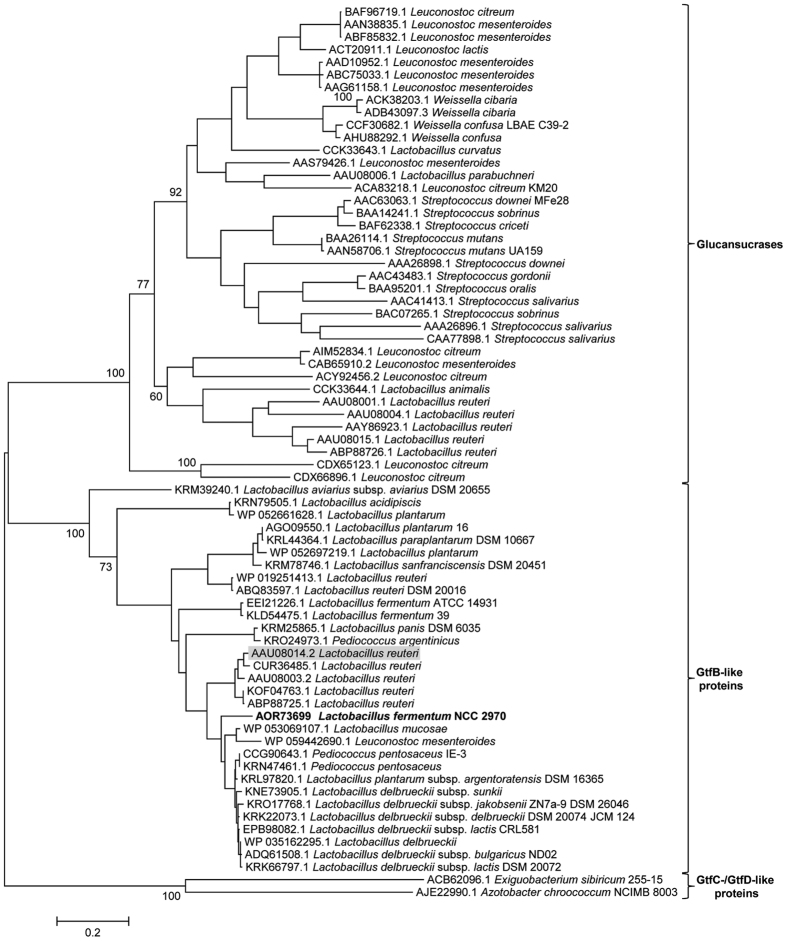
Figure 1. Phylogenetic tree constructed on the basis of complete amino acid sequence alignment of some of the characterized GH70 proteins annotated in the CAZy database, and of (putative) GH70 GtfB-like proteins identified by a BLAST search using the L. fermentum NCC 2970 GH70 protein as query sequence (shown in bold).
The evolutionary history was inferred by using the Maximum Likelihood method based on the JTT matrix-based model. The bar represents a genetic distance of 0.2 substitutions per position (20% amino acid sequence difference). The bootstrap values adjacent to the main nodes represent the probabilities based on 1000 replicates. The protein sequences are annotated by their Genbank accession number and bacterial origin. The L. reuteri 121 GtfB 4,6-α-GTase is highlighted with a grey background.

