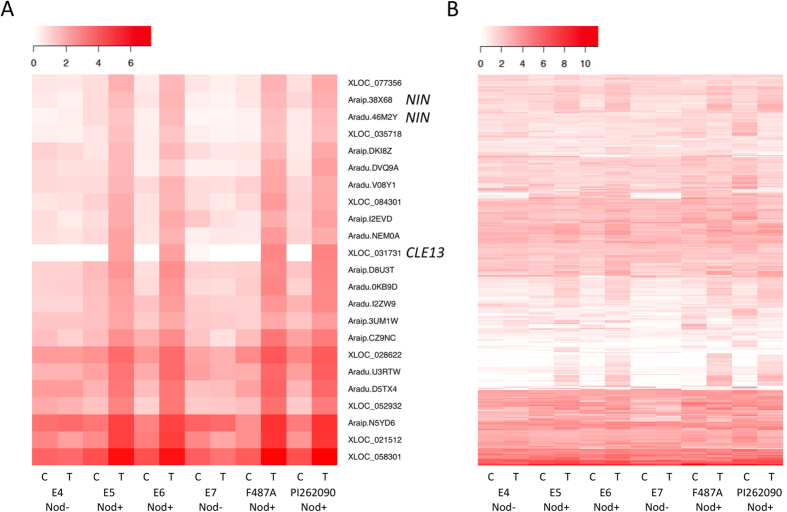
Figure 3. Heat maps of the differentially expressed genes specifically in nodulating genotypes of the six genotypes inoculated and un-inoculated with rhizobia.
Transformed FPKM values were used. “White’ color indicates no expression or low expression level; and “red” color indicates high expression level. ‘C’ indicates ‘control’; ‘T’ indicates ‘treatment’. (A) Expression profiles of the 23 core up-regulated genes shared by all four nod+ genotypes. (B) Expression profiles of all 544 differentially expressed genes.

