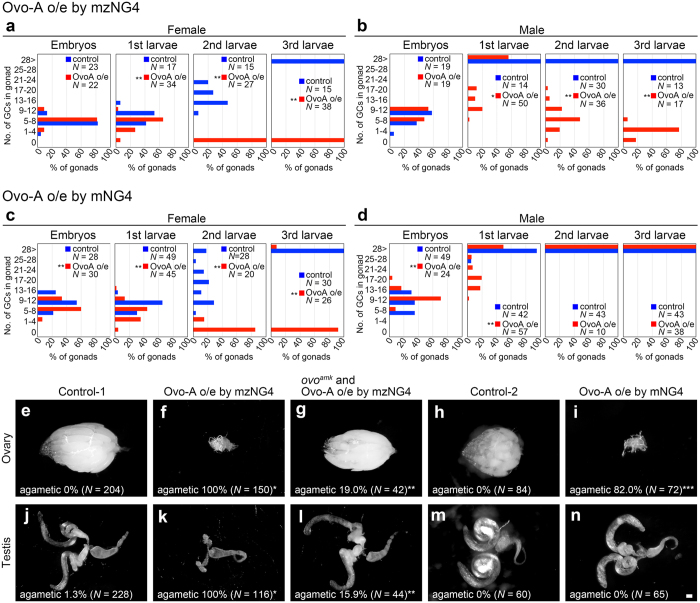
Figure 2. Germline-specific expression of Ovo-A causes germline loss in males and females.
(a–d) Distribution of the number of Vasa-positive germline cells per gonad of Ovo-A–expressing (red) and control (blue) females (a and c) and males (b and d) at embryonic stage 15–16, the first, second, and third instar larval stages. Ovo-A was expressed under the control of mzNG4 in progeny derived from nos-Gal4 homozygous females mated with UASp-Ovo-A (line#4-2) homozygous males (red bars in a and b). Progeny derived from nos-Gal4 homozygous females mated with y w males were used as controls (blue bars in a and b). Furthermore, Ovo-A was overexpressed under the control of mNG4 in YFP-positive progeny derived from nos-Gal4/TM6B, Dfd-GMR-nvYFP females mated with UASp-Ovo-A (line#4-2) homozygous males (red bars in c and d). YFP-positive progeny derived from nos-Gal4/TM6B, Dfd-GMR-nvYFP females mated with y w males were used as controls (blue bars in c and d). N: the number of gonads observed. Significance of differences relative to controls was calculated using Fisher’s exact test (*P < 0.05, **P < 0.01). (e–n) Ovaries (e–i) and testes (j–n) of adult progeny derived from nos-Gal4 homozygous females mated with y w males (control-1) (e and j), nos-Gal4 homozygous females mated with UASp-Ovo-A (line#4-2) homozygous males (f and k), or ovoamk and nos-Gal4 homozygous females mated with UASp-Ovo-A (line#4-2) homozygous males (g and l); and YFP-positive adult progenies derived from nos-Gal4/TM6B, Dfd-GMR-nvYFP females mated with y w males (control-2) (h and m) or nos-Gal4/TM6B, Dfd-GMR-nvYFP females mated with UASp-Ovo-A (line#4-2) homozygous males (i and n). The ovoamk transgene expresses only Ovo-B under the control of the ovo-B promoter14. Ovaries and testes were stained with an anti-Vasa antibody, and the gonads without Vasa signal were categorized as agametic. The percentage of agametic gonads is shown at the bottom of each panel. N: the number of gonads examined. Significance of difference relative to control-1 (*), Ovo-A o/e by mzNG4 (**), or control-2 (***) was calculated by Fischer’s exact test (P < 0.01). Scale bar: 100 μm.

