
Figure 3. Gene expression significantly changed both in the comparison between control and Ovo-B KD PGCs, and between PGCs and whole embryos.
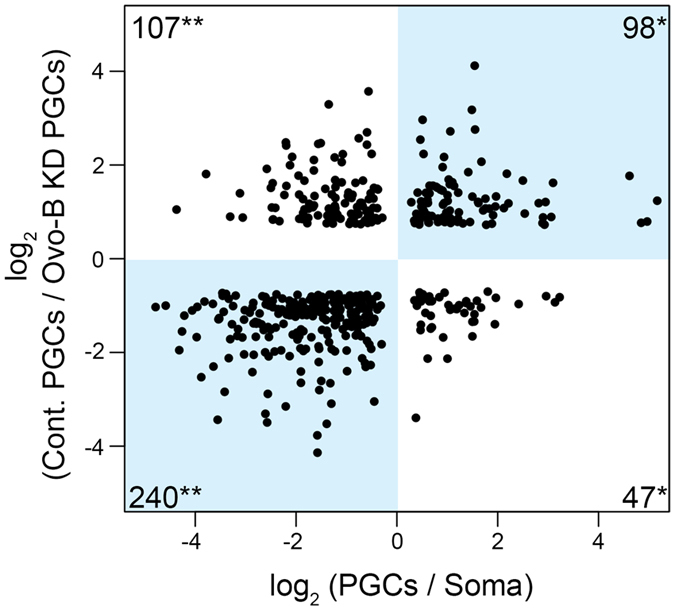
The x-axis shows the log2 fold change in gene expression between PGCs and whole embryos. The y-axis shows the log2 fold change in gene expression between control PGCs and Ovo-B KD PGCs. Spots represent genes whose expression levels differed significantly between controls and Ovo-B KD PGCs (q-value < 0.05), and between PGCs and whole embryos (q-value < 0.05). When multiple microarray probes mapped to a single gene, the average value of the log2 fold change was used. The numbers of genes plotted are shown in the corners of each quadrant. Among 145 PGC-enriched genes, which are plotted in the right half, more genes were down-regulated than up-regulated by Ovo-B KD [*P < 0.01 (Fisher’s exact test)]. By contrast, among 347 soma-enriched genes, plotted in the left half, more genes were up-regulated than down-regulated by Ovo-B KD [**P < 0.01 (Fisher’s exact test)].