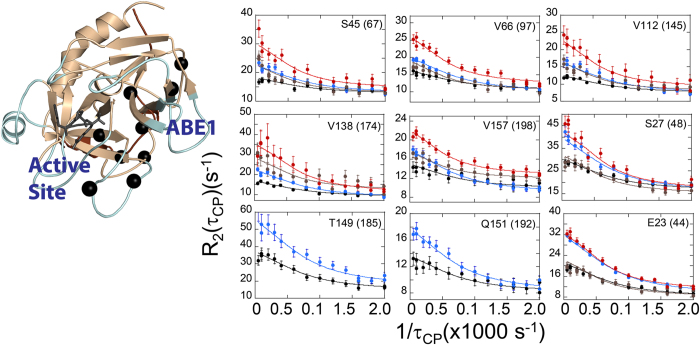
Figure 5. Relaxation dispersion curves for the nine residues that retained significant μs-ms motions in PPACK-thrombin.
The color scheme for the dispersion data is as in Fig. 3. The plots are aligned with the residue location in the structure and corresponding residues are marked with black spheres.

