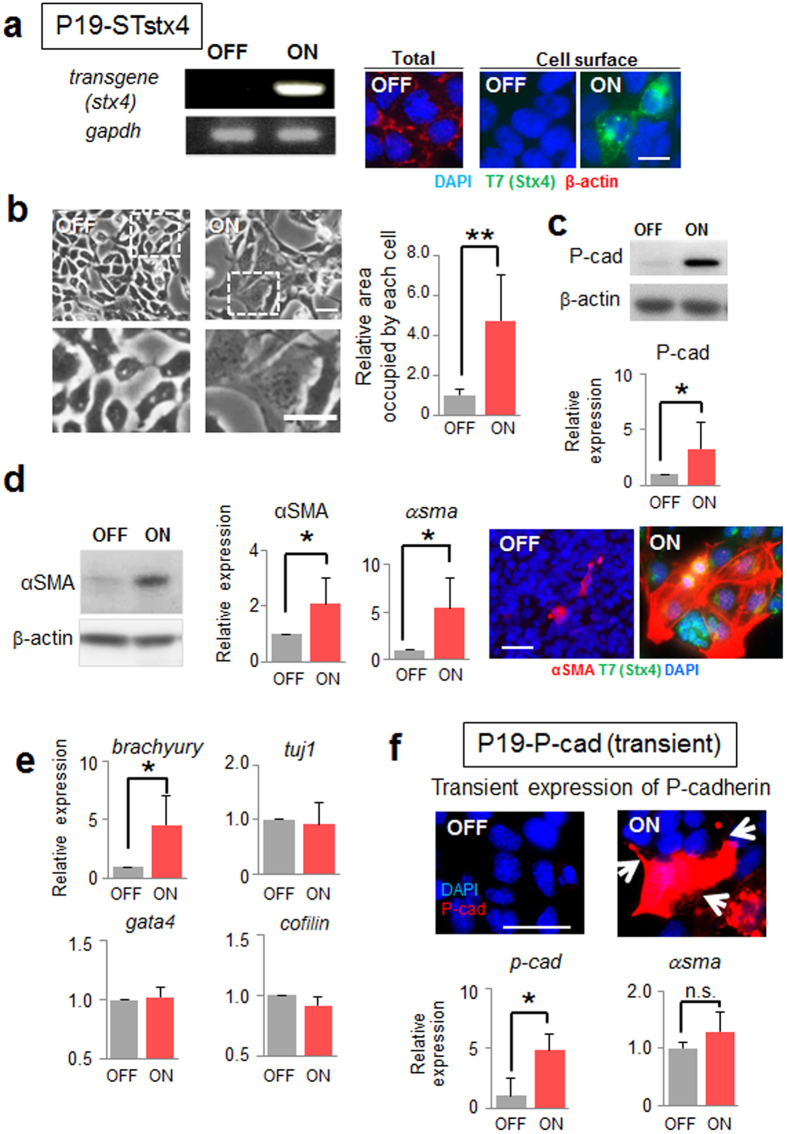
Figure 7. Effect of cell surface expression of syntaxin-4 on P19CL6 cell behavior.
(a), The cell surface expression of syntaxin-4 transgene in P19-STstx4 was investigated with RT-PCR (left) and immunocytochemistry (right) after 72-h transgene induction. Bar, 10 μm. (b), Left, cells displaying flattened morphology upon cell surface expression of syntaxin-4 (ON). Lower panels, enlarged images of insets in upper images. Bars, 20 μm. Right panel, quantification of the relative area occupied by each cell. N = 10, **p < 0.01. (c), The expression of P-cadherin is increased also in this cell type in response to the expression of syntaxin-4 (upper). The representative blots cropped from the original blots (Supplementary Fig. S1) are shown. Lower panel, the amount of P-cadherin relative to that of β-actin. N = 3, *p < 0.05. (d), The mesodermal marker αSMA is upregulated by cell surface syntaxin-4 (ON). Left, representative blots cropped from the original blots (Supplementary Fig. S1) are shown. Middle, quantification of the expression of αSMA protein and mRNA relative to those of β-actin. N = 4, *p < 0.05. Right, expression of αSMA (red) and T7-syntaxin-4 (green) in cells with (ON) and without (OFF) cell surface syntaxin-4. Bar, 20 μm. (e), Expression of several differentiation markers, including the mesodermal marker brachyury, the ectodermal marker tuji1, the endodermal marker gata4, and the actin dynamics regulator cofilin. N = 4 (for cofilin, N = 3), *p < 0.05. P19CL6 cells with a flattened morphology resulting from cell surface syntaxin-4 differentiate into mesodermal lineages. (f), Transient expression of exogenous P-cadherin (red in upper images) in P19CL6 cells leads to flattened cell morphology with active filopodia (arrows), whereas the differentiation marker αsma is unchanged (lower). Bar, 20 μm. N = 3, *p < 0.05.

