
Figure 4. Box plot showing the RMSD values in pose using different native protein structures.
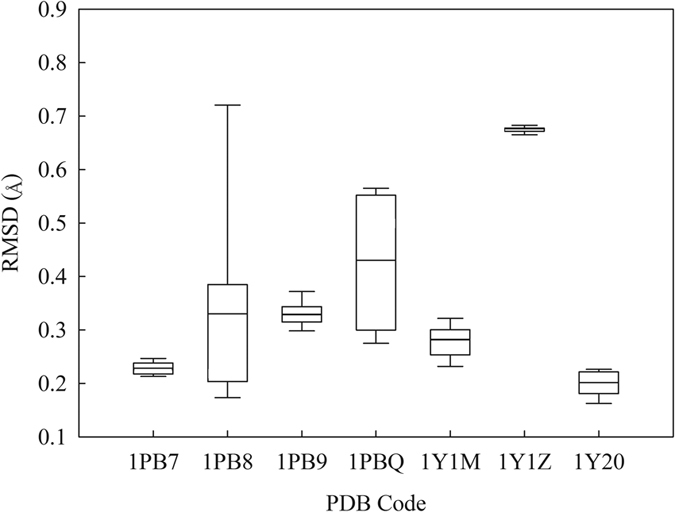
Boxes represent the mean ± standard deviation, lines depict the median values, and whiskers denote the minimum and maximum values.
Official websites use .gov
A
.gov website belongs to an official
government organization in the United States.
Secure .gov websites use HTTPS
A lock (
) or https:// means you've safely
connected to the .gov website. Share sensitive
information only on official, secure websites.
Boxes represent the mean ± standard deviation, lines depict the median values, and whiskers denote the minimum and maximum values.