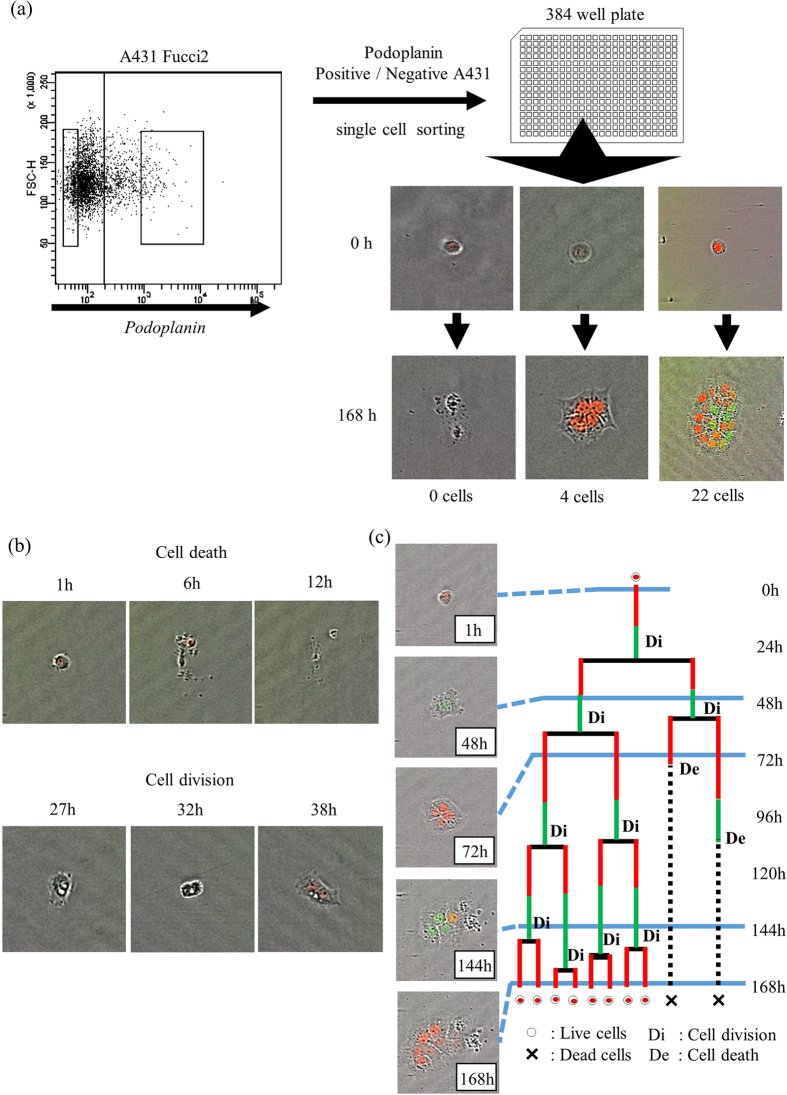
Figure 1. Schema of the experiment.
(a) PDPN expression of A431/Fucci2 cells (upper left dot plot). Single PDPN+ or PDPN− A431/Fucci2 cells was sorted and cultured in 384 well plate. Left panel; No viable cells were observed after 7 days. Middle panel; Single sorted cell created a “small” colony consisting of four progenies. Right panel; Single sorted cell created a “large” colony consisting of twenty-two progenies. (b) Typical morphological appearances of “cell death” and “cell division”. Upper panel; At 6 h to 12 h culture time, reduction of cellular volume, and cell bursts were observed, which defined as “cell death”. Lower panel; At 32 h culture time, cleavage furrow formatted and separated two cells both of which have red nuclear fluorescence were observed at 38 h (cell division). (c) Cell fate map of A431/Fucci2 cells. Based on Fucci fluorescent, cell cycle status, cell division and cell death were identified. Length of the red lines and the green lines reflected the length of G0/G1 phase and the length of S/G2/M phase, respectively.

