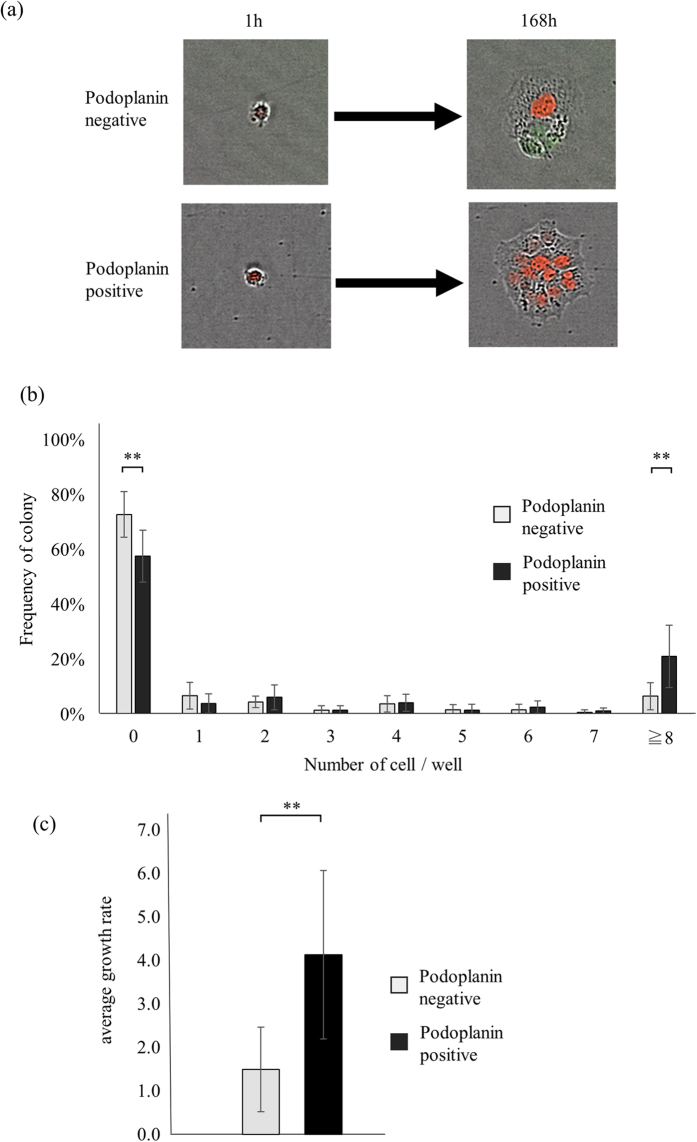
Figure 2. Growth of single PDPN+- and PDPN−- derived cells.
(a) Representative samples of colonies at the 7th day. Upper panel; a single PDPN− A431 cell created a small colony consisting of three cells. Lower panel; a single PDPN+ A431 cell created a large colony consisting of 14 cells. (b) The number of live progenies per well after 7 days in culture. Results of five experiments are summarized. (c) Growth rates. Values are means ± S.D. from five independent experiments. Statistical analysis was performed using Student’s t-test. **p < 0.05.

