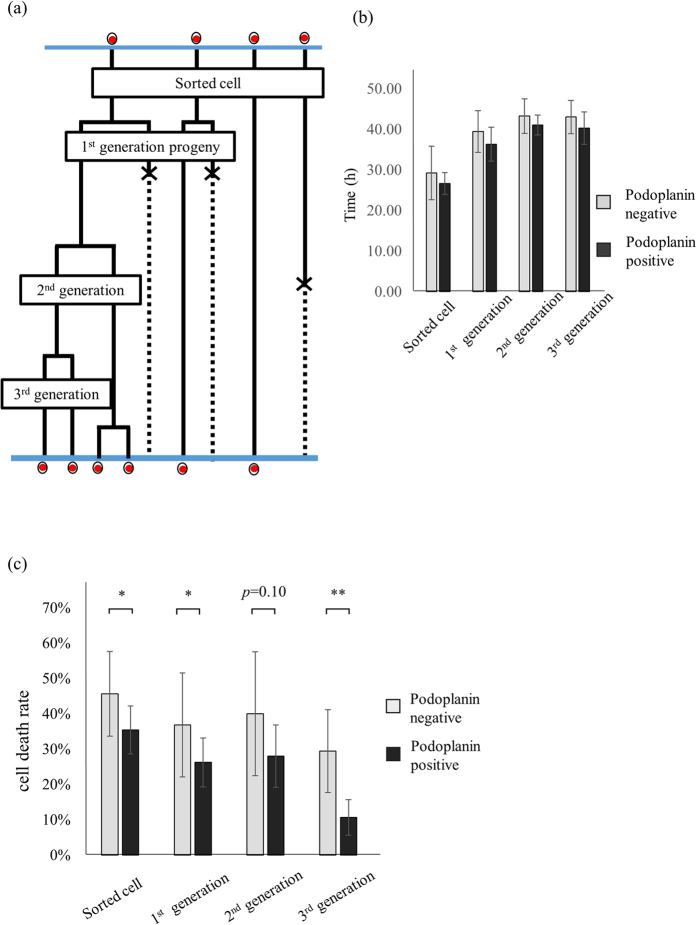
Figure 5. Cell cycle status and cell death ratio of each generation.
(a) Cell fate map focusing on each generation. In the beginning, there were four “sorted cells”. Two of them divided and produced four daughter cells, defined as “1st generation progenies”. Two the four cells died, while one divided into two new cells, defined as “2nd generation progenies”. This cell divided, giving the “3rd generation progeny”. (b) Cell cycle status of progeny of each generation, deriving from single PDPN+ and PDPN− cells. (c) Cell death ratios of grown cells of each generation. Values are means ± S.D. from five independent experiments. Statistical analysis was performed using Student’s t-test. *p < 0.1, **p < 0.05.

