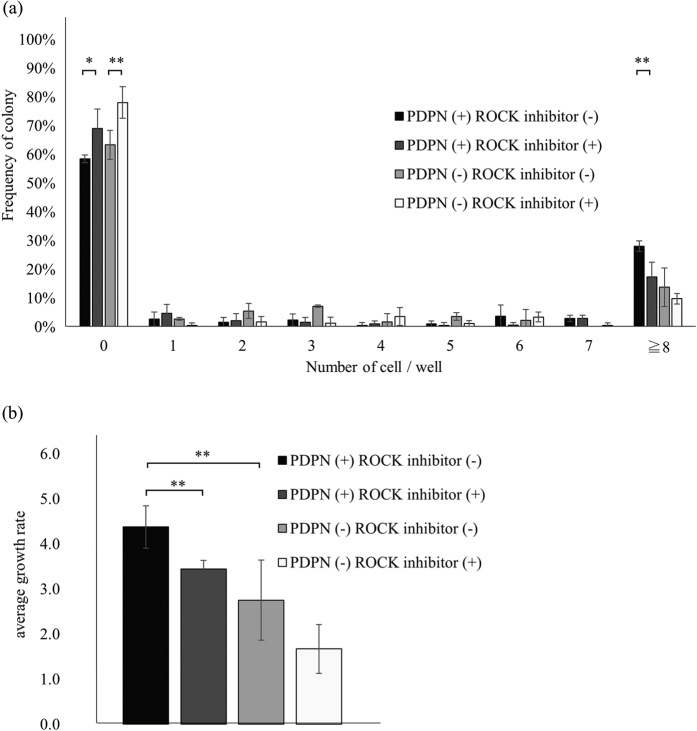
Figure 7. ROCK inhibitor treated A431 cells.
(a) The number of living cells per well after 7 days in culture, in the presence of a ROCK (Rho-associated coiled-coil kinase) inhibitor. (b) Growth rate of ROCK inhibitor treated A431 cells. Results of three experiments are summarized. Values are means ± S.D. from three independent experiments. Statistical analysis was performed using Student’s t-test. **p < 0.05.

