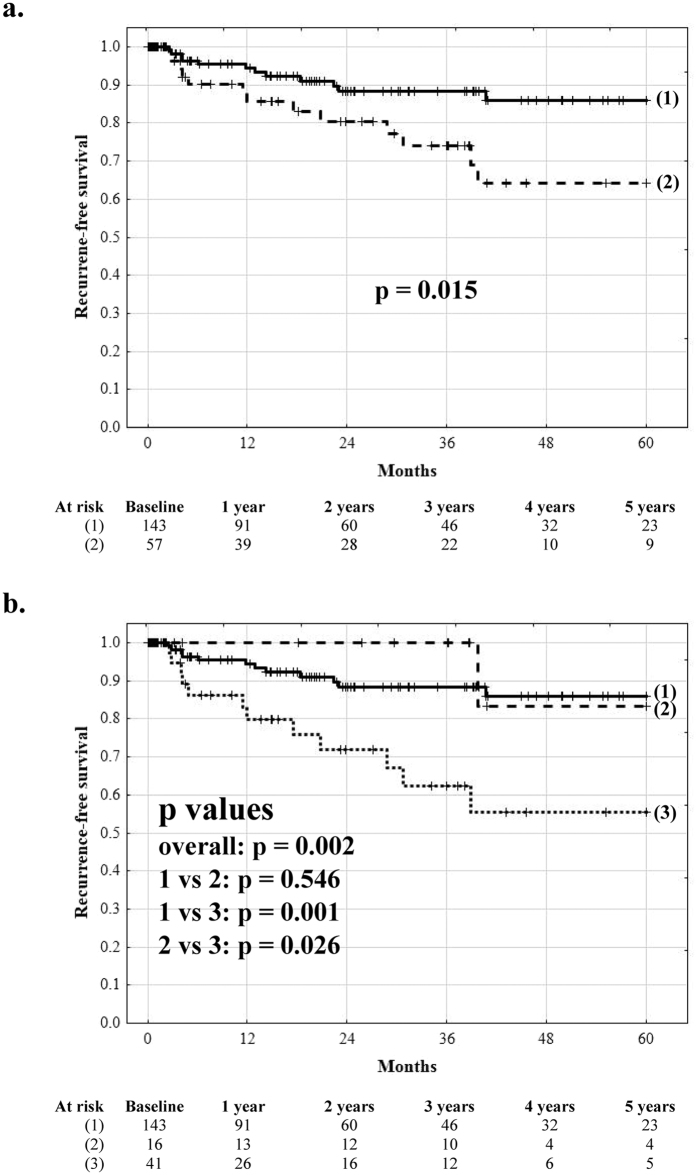
Figure 2. The impact of low- and high-risk microvascular invasion on outcomes after liver transplantation.
Recurrence-free survival curves after liver transplantation in (a) patients with (dashed line) and without (solid line) microvascular invasion, and (b) in patients without microvascular invasion (solid line), patients with microvascular invasion unpredicted by the model (dashed line), and patients with microvascular invasion predicted by the model (dotted line). Numbers of patients at risk are presented below the graphs.

