Figure 2.

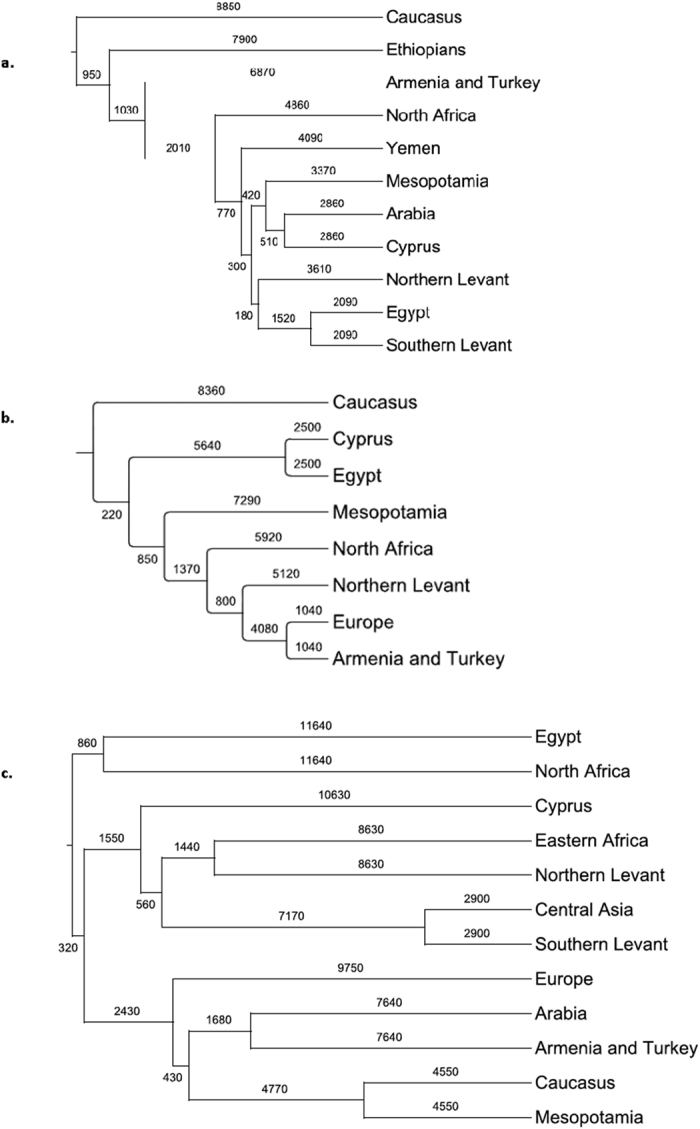
BATWING population split time estimates for Middle Eastern populations marking expansion histories for haplogroups (a) J1, (b) J2 and (c) E1b1b1.

BATWING population split time estimates for Middle Eastern populations marking expansion histories for haplogroups (a) J1, (b) J2 and (c) E1b1b1.