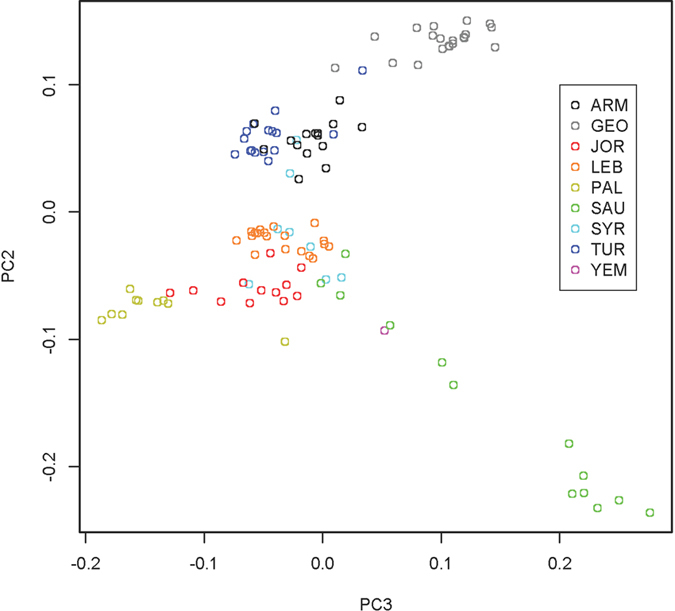
Figure 4. PCA showing Genome-wide analysis of populations from Southwest Asia using 188,974 autosomal SNPs.

Eigenvalues were 3.76 × 10⁵ for PC1 (not plotted, reported for scale), 2.16 × 10⁵ for PC2, and 1.62 × 10⁵ for PC3.

Eigenvalues were 3.76 × 10⁵ for PC1 (not plotted, reported for scale), 2.16 × 10⁵ for PC2, and 1.62 × 10⁵ for PC3.