
Figure 4. Manipulation of Rad51 expression levels altered gene expression of Netrin-1 receptors.
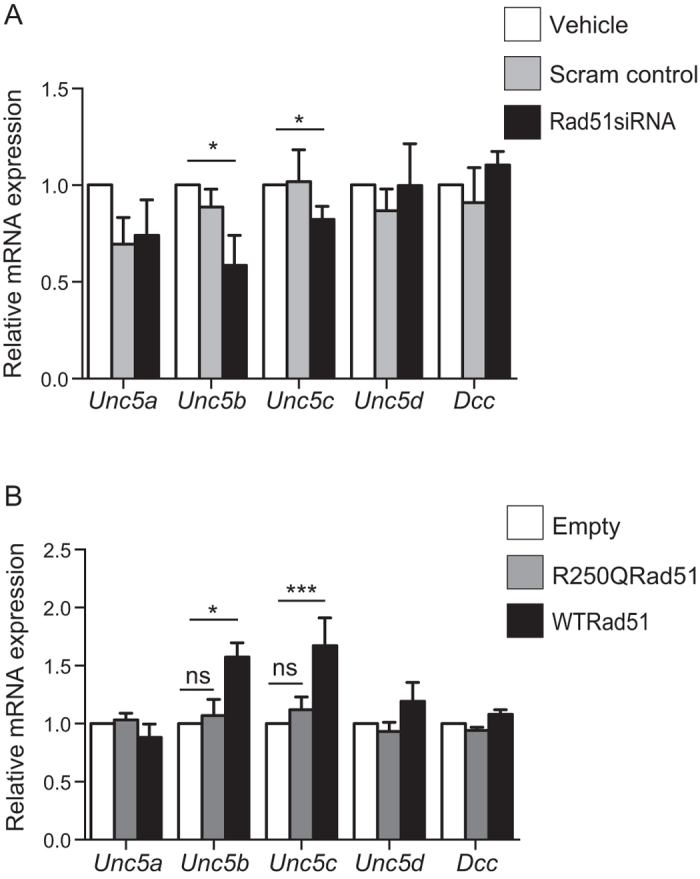
(A) Bar graph showing qPCR quantification of Netrin-1 receptor mRNA expression in neurons targeted with Rad51siRNA, Scram siRNA (control) or vehicle. (B) Bar graph showing qPCR quantification of Netrin-1 receptor mRNA expression in neurons transfected with EYFP, EYFP-RAD51, or EYFP-R250Q. Values shown are mean ± SEM. *p < 0.05.