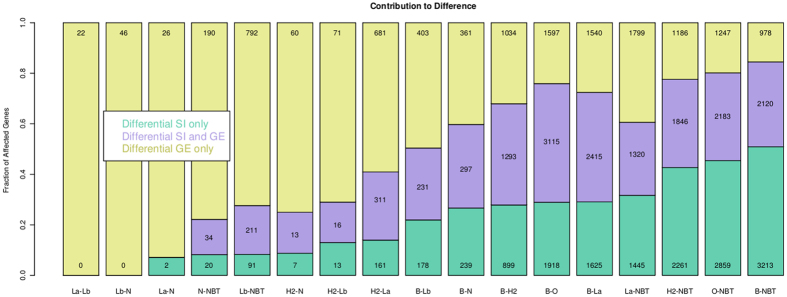
Figure 2. Pairwise transcriptional differences between tumour subtypes and NBT.
Each bar represents the results of comparison between two groups of samples. Key: B = basal-like, H2 = HER2, La = LuminalA, Lb = LuminalB, N = Normal like, O = Others (non-basal-like rumour), NBT = normal breast tissue. The relative fractions of genes differentially expressed, with differential splicing balances or both are reported in different colours. The absolute numbers of genes falling into each of these categories is also reported.

