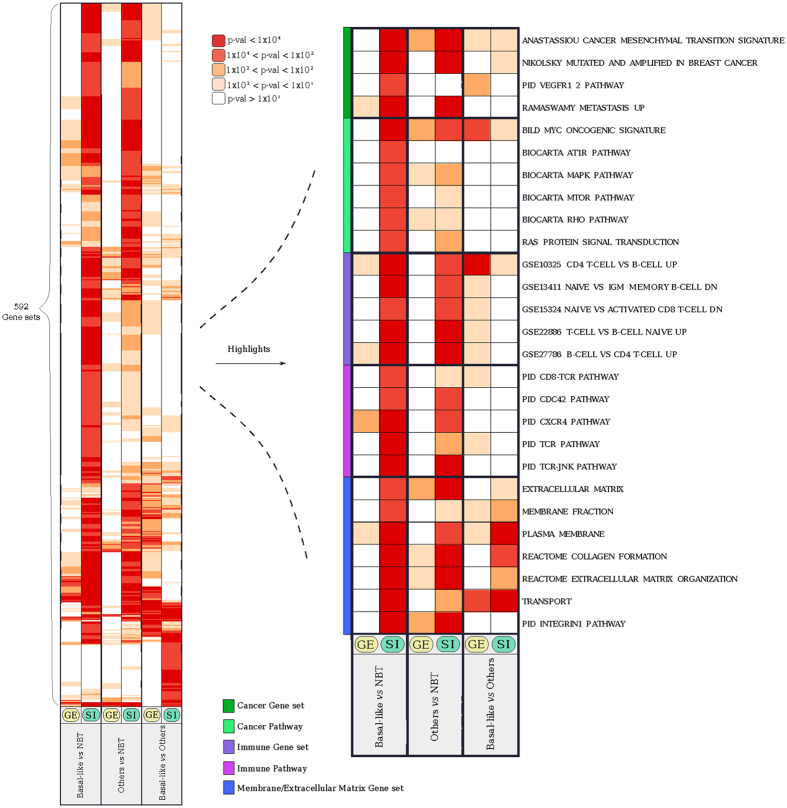
Figure 4. Heatmap of gene sets and pathways specifically perturbed by splicing imbalances.
Each column represents a pairwise comparison (either at GE or SI level), each row is a gene set or a pathway, and color-coded is the significance level of the enrichment. On the left are represented the complete results of the analysis. On the right, a selection of specific gene sets and pathways is highlighted showing specific perturbations related to cancer, immune system, and transport and membrane. All reported gene sets and pathways are significantly enriched in at least one of the three pairwise comparisons illustrated. Gene sets are grouped in five different classes as indicated by the side colour bar.

