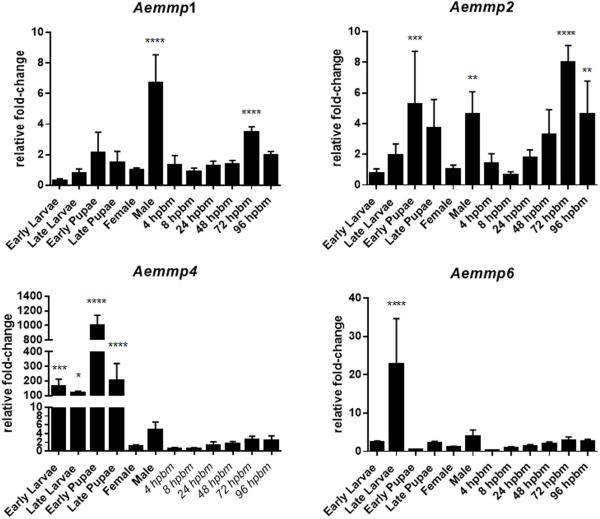
Figure 3.
Expression profiles for Aemmp1, Aemmp2, Aemmp4, and Aemmp6 during different life stages of Ae. aegypti. Total RNA was extracted from HWE mosquitoes at different life cycle stages and from whole-body females, which had received a sugarmeal or a bloodmeal (4-96 hpbm). Relative fold-change transcript abundance was analysed by qRT-PCR for each AeMMP gene by normalizing reads against the abundance of ribosomal protein S7 transcripts. Values were then set in relation to the gene expression level in sugarfed females (baseline value = 1 relative fold-change). Mean values with standard deviations (SD) from three independent experiments are shown. Statistical analysis was performed using a one-way analysis of variance (ANOVA) followed by Tukey's multiple comparisons test (* at p ≤ 0.05).

