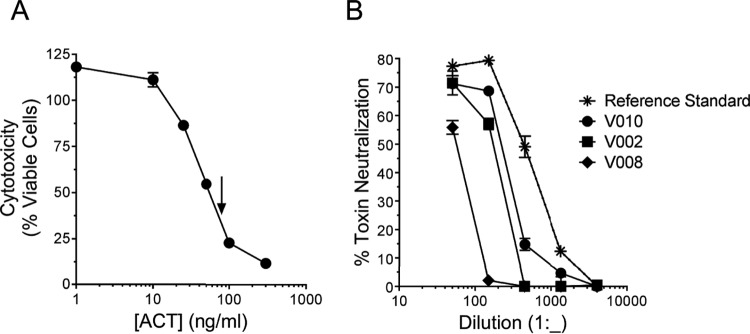
FIG 3.
Summary of anti-ACT IgG ELISA, toxin neutralization assay, and anti-PT IgG ELISA results. Shown are the results of the anti-ACT IgG ELISA (x axis) and TNA (y axis) for all human serum samples. Red symbols indicate anti-PT ELISA-positive samples, and black symbols represent anti-PT IgG ELISA-negative samples. Closed circles represent serum from pertussis-diagnosed subjects (PCR positive with symptoms), and stars represent serum samples from control subjects. The dashed line indicates the cutoff for a positive anti-ACT IgG ELISA value. Data represent the mean of the results from each sample tested in duplicate (ELISA) or triplicate (TNA).

