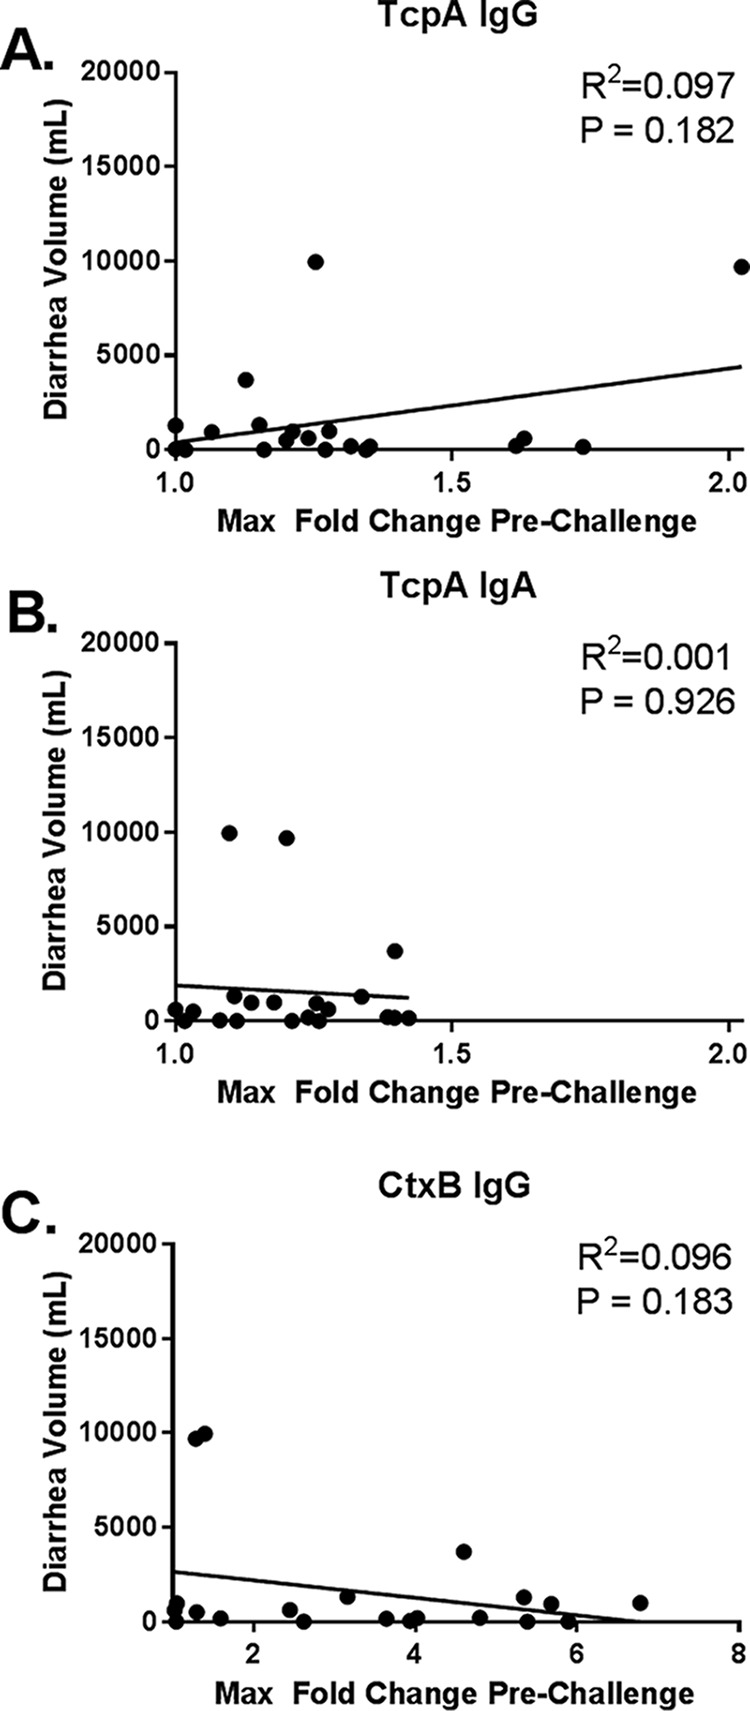
FIG 4.

Correlation of maximum fold change before 90-day challenge relative to diarrhea volume following cholera challenge. Shown are the vaccinee maximum (max) fold changes for anti-TcpA IgG (A), anti-TcpA IgA (B), and anti-CtxB IgG (C) antibodies before 90-day challenge relative to cumulative diarrhea volume following 90-day challenge. The line represents a linear regression with R2 and P values for normalized data.
