
Figure 3.
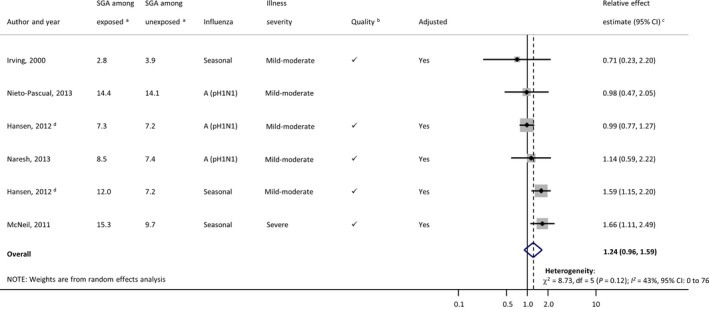
Forest plot of individual study results for association between influenza illness during pregnancy and small‐for‐gestational‐age (SGA) birth. Small, black diamond markers indicate individual study point estimate, with corresponding 95% confidence intervals (CIs) represented by horizontal bars. aRisk of SGA birth per 100 women classified as having (exposed) or not having (unexposed) influenza illness/infection during pregnancy. b’ ’ indicates a Newcastle‐Ottawa Score ≥8, risk of diagnostic ascertainment bias not rated as ‘very high’, and exposure not measured using self‐reported questionnaire. cCrude estimates were used in place of adjusted estimates when the latter were not provided. dHansen (2012)40 is shown twice: one estimate for 2009 A (pH1N1) and one for 2008–2009 influenza season.