
Figure 2.
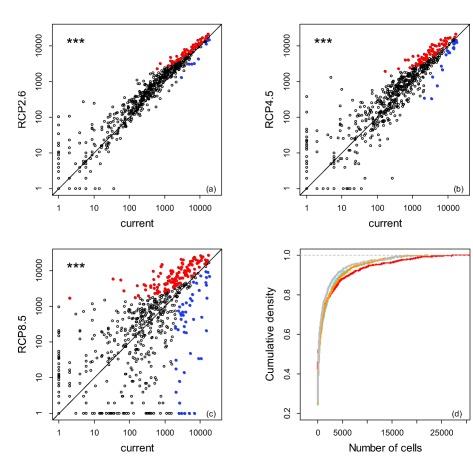
(a)–(c) Comparison of the number of cells climatically suitable for the 783 ornamental species under current climatic conditions and three different climate change scenarios (RCP2.6, RCP4.5, RCP8.5). Asterisks symbolize significant differences in the mean number of cells (P < 0.001). Blue and red points symbolize species that loose or gain > 1600 cells (c. 5% of the study area) in comparison with current climate conditions, respectively. (d) Cumulative density of the number of cells occupied by the species, i.e. the probability that a randomly selected species has a climatically suitable range < x under current climatic conditions (grey), and under the three climatic scenarios (RCP2.6, light blue; RCP4.5, orange; RCP 8.6, red). In (a)–(c) axes are log‐scaled.