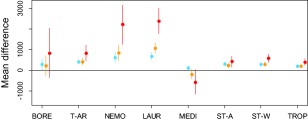
Figure 3.

Mean difference in the number of cells climatically suitable to the 783 ornamental species under current climatic conditions and three different climate change scenarios (RCP2.6, RCP4.5, RCP8.5), separated by species zonobiome of origin. Points symbolize observed mean differences and lines 0.95 confidence intervals as derived from permutation tests. Key: blue, RCP2.6; orange, RCP4.5; red, RCP8.5; BORE, boreal; T‐AR, temperate‐arid; NEMO, nemoral (= temperate); LAUR, laurophyllous; MEDI, Mediterranean; ST‐A, subtropical‐arid; ST‐W, subtropical seasonally dry; TROP, tropical.
