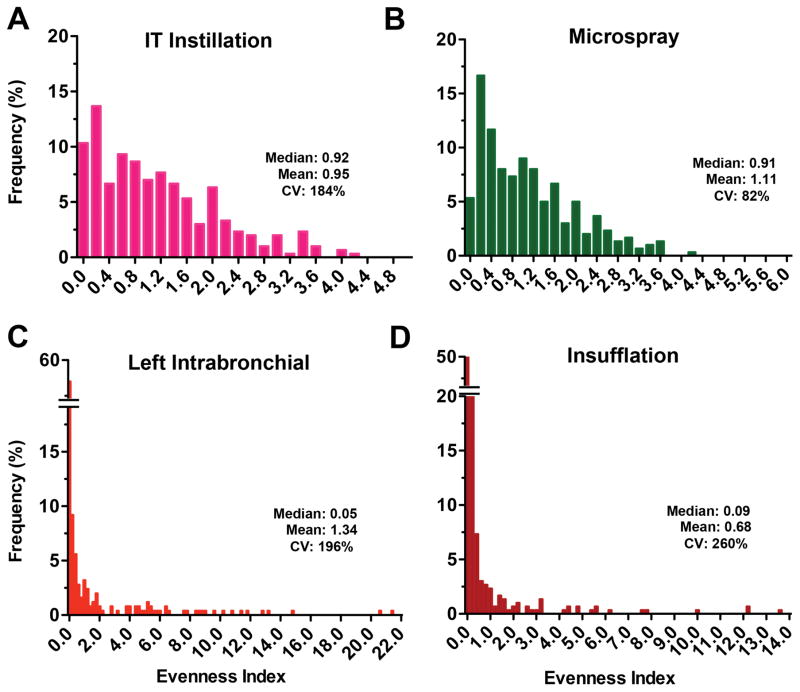
Figure 5.
Relative frequency distribution of evenness indices at 24 hours after administration of 141CeO2 nanoparticles. The evenness index of each lung piece from 6 rats/group was determined and the overall evenness index distribution is shown for IT instillation (A), microspray instillation (B), left intrabronchial instillation (C) and insufflation (D). Data are relative frequency of evenness indices of 300 lung pieces (50 pieces/rat, 6 rats/group). The x axes show the inclusive lower limit of each bar.

