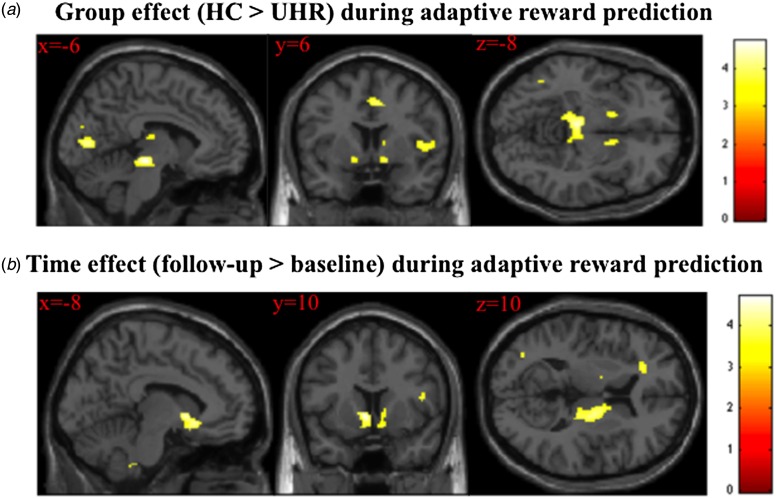
Fig. 3.
(a) Greater activation during adaptive reward prediction in healthy controls (HC) compared with ultra-high-risk (UHR) subjects across both visits. (b) Greater activation at follow-up relative to baseline during adaptive reward prediction across both groups. Images are displayed at a cluster-forming threshold of p < 0.001 uncorrected, with an extent threshold of 20 voxels. Colour bars indicate t values.

