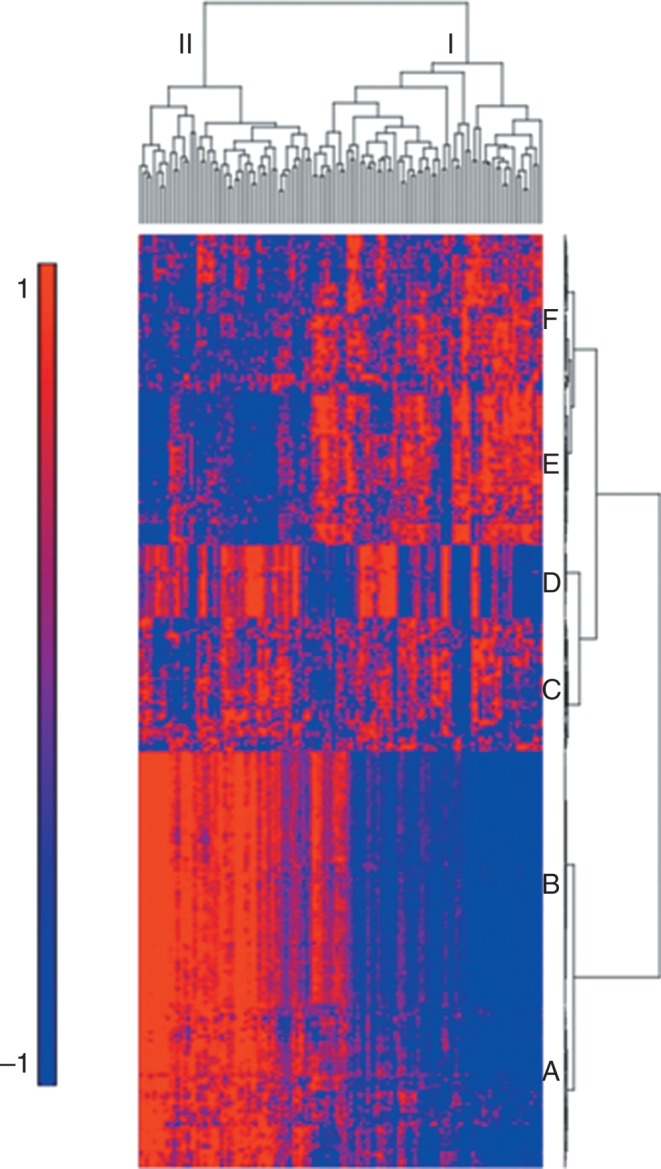
Fig. 3.

Gene expression profiling identifies two subtypes of idiopathic pulmonary fibrosis (IPF). mRNA profiles from 119 IPF lungs were subject to hierarchical clustering based on the expression of 472 transcripts that are differentially expressed at 5% false discover rate (FDR) and with greater than 2-fold change in IPF compared to control lung. Decreased expression is represented by blue color, whereas red indicates increased expression. Adapted from Figure 1 in Yang et al. (15).
